. 2009 Aug 26;29(34):10638-52.
doi: 10.1523/JNEUROSCI.2807-09.2009.

Retinotopic organization of human ventral visual cortex

Affiliations

Retinotopic organization of human ventral visual cortex

Michael J Arcaro et al. J Neurosci. .

Abstract

Functional magnetic resonance imaging studies have shown that human ventral visual cortex anterior to human visual area V4 contains two visual field maps, VO-1 and VO-2, that together form the ventral occipital (VO) cluster (Brewer et al., 2005). This cluster is characterized by common functional response properties and responds preferentially to color and object stimuli. Here, we confirm the topographic and functional characteristics of the VO cluster and describe two new visual field maps that are located anterior to VO-2 extending across the collateral sulcus into the posterior parahippocampal cortex (PHC). We refer to these visual field maps as parahippocampal areas PHC-1 and PHC-2. Each PHC map contains a topographic representation of contralateral visual space. The polar angle representation in PHC-1 extends from regions near the lower vertical meridian (that is the shared border with VO-2) to those close to the upper vertical meridian (that is the shared border with PHC-2). The polar angle representation in PHC-2 is a mirror reversal of the PHC-1 representation. PHC-1 and PHC-2 share a foveal representation and show a strong bias toward representations of peripheral eccentricities. Both the foveal and peripheral representations of PHC-1 and PHC-2 respond more strongly to scenes than to objects or faces, with greater scene preference in PHC-2 than PHC-1. Importantly, both areas heavily overlap with the functionally defined parahippocampal place area. Our results suggest that ventral visual cortex can be subdivided on the basis of topographic criteria into a greater number of discrete maps than previously thought.


Figures
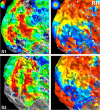
Figure 1.
Figure 1.
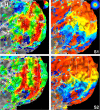
Polar angle and eccentricity maps in human ventral visual cortex obtained in attentionotopy studies: right hemisphere. Flattened surface reconstructions of early and ventral visual cortex of two representative subjects (S1 and S2). The left shows the polar angle maps; the right shows the eccentricity maps. The color code indicates the phase of the fMRI response and indicates the region of the visual field to which the surface node responds best. White lines denote area boundaries, which are formed by phase angles at or close to the upper (dotted) or lower (dashed) vertical meridian. Purple lines denote the reversal in eccentricity between hV4 and VO-1. Asterisks indicate foveal representations. Maps were thresholded at 1.5 s per cycle SEM variance (see Materials and Methods). Significant polar angle and eccentricity phase information was observed lateral to VO and PHC. This part of cortex was not further investigated in the present study. In the eccentricity maps, phase estimates adjacent to the far periphery of early visual cortex represent cortex that was only weakly activated by the visual display (i.e., 15°) and are colored in red attributable to the continuous color scale.
Figure 2.
Figure 2.
Polar angle and eccentricity maps in human ventral visual cortex obtained in attentionotopy studies: left hemisphere. Flattened surface reconstructions of early and ventral visual cortex of the same subjects (S1 and S2) shown in Figure 1. All conventions as in Figure 1.
Figure 3.
Figure 3.
Analysis of topographic organization within areas hV4, VO-1, VO-2, PHC-1, and PHC-2. A, Polar angle maps of early and ventral visual cortex for the LH are shown for subject S1 (obtained in attentionotopy studies). Response phase was analyzed as a function of distance on the surface by drawing small line segments, as indicated in A, that run in parallel to the polar angle progression and perpendicular to the eccentricity progression. The line segments were successively drawn from the posterior border of hV4 to the anterior border of PHC-2. The blue dots indicate the phase values for individual nodes located along the line segments. The red line indicates the average phase values as a function of distance on the surface. The smooth progression of phase values as a function of distance on the map is apparent. Importantly, the response phase reverses at the shared boundaries between adjacent areas (red arrows). B, Group polar phase plots are shown for both RH and LH (n = 8). Response phases between identified area borders were interpolated into a common space, which allowed for intersubject averaging. The blue dots indicate phase values for individual subjects after interpolation. The red line indicates the group average. The smooth progression of phase values between identified area borders is apparent in the group averages as well as in the individual subjects.
Figure 4.
Figure 4.
Estimated surface volume for V1, hV4, VO-1, VO-2, PHC-1, and PHC-2. A, Surface volumes in cubic millimeter for right (light gray) and left (dark gray) hemispheres of V1, hV4, VO-1, VO-2, PHC-1, and PHC-2 (n = 16). B, Surface volumes for hV4, VO-1, VO-2, PHC-1, and PHC-2 for RH and LH calculated as a percentage of V1 (same data as in A). Vertical bars indicate SEM. On average, hV4 was approximately half the size of V1, and visual areas VO-1 to PHC-2 were between one-quarter and one-third the size of V1.
Figure 5.
Figure 5.
Response amplitudes as a function of temporal frequency in PHC-1 and PHC-2. Results from attentionotopy studies. Data were averaged across 16 hemispheres for PHC-1 and PHC-2. The top panel shows the results for the polar angle measurements, the bottom those for the eccentricity measurements. The response at the SF was significantly greater than the response at other frequencies. Light gray bars denote the noise level, calculated as the mean amplitude across all frequencies.
Figure 6.
Figure 6.
Visual field representation in areas V1, hV4, VO-1, VO-2, PHC-1, and PHC-2. Vertice plots from each individual subject and group analysis (n = 8) based on polar and eccentricity maps thresholded at 1.5 s of the cycle SEM variance (see Materials and Methods) obtained in the attentionotopy studies. Surface nodes that had significant phase estimates for both polar angle and eccentricity were plotted such that each point represents the corresponding preferred visual field location for a given node. Red and blue points indicate data from the RH and LH, respectively. All areas showed strong contralateral preference. HV4, VO-1, VO-2, PHC-2, and to some degree PHC-1 showed a smaller representation of the LVF relative to the UVF. HV4 and VO-1 demonstrated an almost exclusive activation of the visual field representation within 0–7.5° eccentricity. In contrast, PHC-1 and PHC-2 represented the fovea and eccentricities ranging from 7.5 to 15° better than other eccentricities.
Figure 7.
Figure 7.
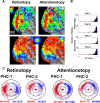
Comparison of maps obtained in retinotopy and attentionotopy studies. A, Polar angle and eccentricity maps of ventral visual cortex from subject S3 (left hemisphere). The left shows the maps obtained with standard retinotopy mapping procedures with subjects performing a fixation task. The right shows the results for the attentionotopy studies from the same subject. The overall activation pattern is similar and consistent across the two mapping approaches. The posterior and anterior borders of PHC-1 were apparent in the retinotopy studies, albeit a somewhat more patchy representation. Particularly, the anterior border of PHC-2 was more clearly seen in the attentionotopy data in this subject. The eccentricity maps look nearly identical with the different measurements. All maps were thresholded at 1.5 s of the cycle SEM variance. B, Histograms of alignment indices (AI = 1 − |Δϕ| /π) for PHC-1 and PHC-2 for subject S3. The index values peak around an index value close to 1, which indicates good alignment between attentionotopy phase estimates and retinotopy estimates for polar angle and eccentricity. The red line illustrates a distribution for uncorrelated data. C, Vertice plots for PHC-1 and PHC-2 from retinotopy and attentionotopy studies (n = 4). A smaller amount of nodes was activated in PHC-1 and PHC-2 in the retinotopy compared with the attentionotopy studies. However, the overall characteristics of visual field representation are consistent across the two paradigms, particularly the greater representation of the UVF in PHC-2 and the emphasis on peripheral eccentricities. For other conventions and additional details, see Figure 5.
Figure 8.
Figure 8.
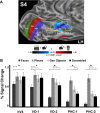
Responses to object stimuli in ventral visual cortex. A, Overlap of the PPA, as defined based on the contrast scenes versus objects, with polar angle maps obtained in attentionotopy studies. The PPA heavily overlaps with PHC-1 and PHC-2. Face-selective activations, as defined by contrasting faces and objects, are shown for additional reference. Outlines of the PPA defined at p < 0.001 (yellow) and p < 10−10 (magenta) are shown. B, FMRI signals in mean percentage signal change evoked by various category stimuli in areas hV4, VO-1, VO-2, PHC-1, and PHC-2. Both PHC-1 and PHC-2 showed significantly greater responses to scenes than to other object categories. Vertical bars denote significant differences between categories for paired t tests (p < 0.05, uncorrected).
Figure 9.
Figure 9.
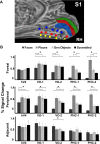
Responses to object stimuli in foveal and peripheral representations of hV4, VO-1, VO-2, PHC-1, and PHC-2. A, Locations of foveal, peripheral, and adjacent ROIs in relation to the borders of hV4, VO-1, VO-2, PHC-1, and PHC-2. B, FMRI signals in mean percentage signal change within foveal, peripheral, and adjacent ROIs of ventral visual areas evoked by various categories of stimuli. Data were averaged across hemispheres and subjects. PHC-1 and PHC-2 showed significantly greater responses to scenes than to other categories in both foveal and peripheral ROIs. There were no significant differences in mean percentage signal change across categories for adjacent ROIs. Vertical bars indicate SEM. Horizontal bars denote significant differences between categories for paired t tests (p < 0.05, uncorrected).
Figure 10.
Figure 10.
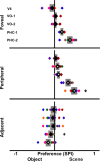
Scene preference index across ventral visual cortex. Index values were calculated by subtracting the mean percentage signal change obtained in response to the preferred category from those obtained in response to the general object category and dividing by the sum of the two. The index values range between 1 and −1, with positive values showing preferred category selectivity for scenes and negative values showing preferred preference for the general object category. For each subject, data were averaged across hemispheres (colored diamonds) and averaged across all eight subjects (black diamond), with the shaded bar representing the SE. Both the foveal and peripheral ROIs in PHC-1 and PHC-2 showed strong preference for scenes. There was no significant preference for scenes in the ROIs adjacent to PHC-1 and PHC-2.

References

    1. Aguirre GK, Zarahn E, D'Esposito M. An area within human ventral cortex sensitive to “building” stimuli: evidence and implications. Neuron. 1998;21:373–383. - PubMed
    1. Bandettini PA, Jesmanowicz A, Wong EC, Hyde JS. Processing strategies for time-course data sets in functional MRI of the human brain. Magn Reson Med. 1993;30:161–173. - PubMed
    1. Boussaoud D, Desimone R, Ungerleider LG. Visual topography of area TEO in the macaque. J Comp Neurol. 1991;306:554–575. - PubMed
    1. Brainard DH. The psychophysics toolbox. Spat Vis. 1997;10:433–436. - PubMed
    1. Brewer AA, Liu J, Wade AR, Wandell BA. Visual field maps and stimulus selectivity in human ventral occipital cortex. Nat Neurosci. 2005;8:1102–1109. - PubMed

Publication types

MeSH terms

LinkOut - more resources