. 2009 Aug 26;29(34):10683-94.
doi: 10.1523/JNEUROSCI.0673-09.2009.

Modulation of the contrast response function by electrical microstimulation of the macaque frontal eye field

Affiliations

Modulation of the contrast response function by electrical microstimulation of the macaque frontal eye field

Leeland B Ekstrom et al. J Neurosci. .

Abstract

Spatial attention influences representations in visual cortical areas as well as perception. Some models predict a contrast gain, whereas others a response or activity gain when attention is directed to a contrast-varying stimulus. Recent evidence has indicated that microstimulating the frontal eye field (FEF) can produce modulations of cortical area V4 neuronal firing rates that resemble spatial attention-like effects, and we have shown similar modulations of functional magnetic resonance imaging (fMRI) activity throughout the visual system. Here, we used fMRI in awake, fixating monkeys to first measure the response in 12 visual cortical areas to stimuli of varying luminance contrast. Next, we simultaneously microstimulated subregions of the FEF with movement fields that overlapped the stimulus locations and measured how microstimulation modulated these contrast response functions (CRFs) throughout visual cortex. In general, we found evidence for a nonproportional scaling of the CRF under these conditions, resembling a contrast gain effect. Representations of low-contrast stimuli were enhanced by stimulation of the FEF below the threshold needed to evoke saccades, whereas high-contrast stimuli were unaffected or in some areas even suppressed. Furthermore, we measured a characteristic spatial pattern of enhancement and suppression across the cortical surface, from which we propose a simple schematic of this contrast-dependent fMRI response.


Figures
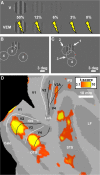
Figure 1.
Figure 1.
Stimulus conditions, stimulus locations, and localizer example. A, The 10 stimulus conditions used were stimuli at five different luminance contrast levels, presented without (V) and with (VEM) simultaneous FEF-EM. 0% V was used as the baseline condition. The main visual effect at 50% contrast (see Materials and Methods) was used as a localizer to identify a common population of visual voxels for additional analysis. B, C, Stimulus locations for MM1 and MM2, respectively. The stimuli were centered on the endpoint of the saccade vector produced by stimulating each electrode above the threshold needed to elicit a saccade. During a given fMRI session, we stimulated at 50% of this behaviorally defined saccade threshold, using only one stimulus and electrode at a time. One stimulus example is shown in each panel, and the dotted white lines indicate the other stimulus positions used for that subject. The red dot in the center represents the fixation spot, which was visible in all conditions. D, A thresholded t-score map (p < 0.001, uncorrected) of the localizer contrast (50% VEM + 50% V vs 0% VEM + 0% V) overlaid on the flattened representation of occipital cortex from MM1. The results shown correspond to the representation of stimulus 3 in B. Sulci are dark gray, and white and black solid lines indicate representations of the vertical and horizontal meridians, respectively. Calc, Calcarine sulcus; CS, central sulcus; IOS, inferior occipital sulcus; IPS, intraparietal sulcus; LF, lateral fissure; LuS, lunate sulcus; OTS, occipitotemporal sulcus; deg, degree.
Figure 2.
Figure 2.
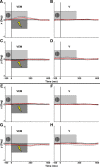
Average eye position aligned to EM onset. A, B, Mean horizontal eye trace for MM1; C, D, mean vertical eye trace for MM1. E, F, Mean horizontal eye trace for MM2; G, H, mean vertical eye trace for MM2. The solid red line plots mean eye position across all sessions and contrasts during VEM and V epochs; the dashed black lines show ±SEM across the four electrodes stimulated. Traces have been aligned to EM onset (VEM) or the matching time in epochs without stimulation (V); total duration of FEF-EM is indicated by the bottom dark gray bar (250 ms). The top light gray bar indicates the period of visual stimulation (VEM, V); visual onset, at −133 ms relative to EM onset, is not shown. Any run showing a significant difference between the two conditions at any time point was removed (p > 0.05, corrected for multiple comparisons across time points; two-sample, two-tailed t test across all acquired trials). These mean traces from the remaining runs show no significant difference at the aggregate level. Deg, Degree.
Figure 3.
Figure 3.
Contrast response functions in different visual areas. Percentage change in MR signal with respect to the baseline, or 0% contrast, condition as a function of luminance contrast for 12 visual cortical areas, including the following: early visual areas V1, V2, V3, and V3A (A); ventral extrastriate areas V4, TEO, and TE (B); areas within the STS, including MT, MST, and FST (C); and higher-order areas LIP and STP (D). See Materials and Methods for a full description of how areal borders were determined. Each trace plots the mean response for all visual voxels localized in a given area, from both subjects across all sessions (only one stimulus location was used in each session). The smooth curves show the best-fitting Naka–Rushton function. Error bars indicate 1 SEM across epochs, and some error bars are smaller than the symbol used. Note that the x-axis has a logarithmic scale, with a break between 0 and 3% contrast.
Figure 4.
Figure 4.
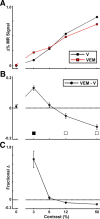
Modulation of the contrast response function in area V1 by microstimulation of the FEF. A, Percentage change in MR signal with respect to the baseline condition in the visual-only (V; black curve) and visual with FEF-EM (VEM; red curve) conditions as a function of luminance contrast. Each trace plots the mean response for all visual voxels localized in V1, from both subjects across all sessions. The fMRI data used to derive the area V4 curves were also used to derive the V4 curves presented by Ekstrom et al. (2008), their Figure 5B. The same holds true for the V4 data presented in Figure 5A. B, Difference in fMRI activity between the VEM and V conditions at each contrast level (a subtraction of the two curves in A). Filled/open squares below the traces indicate a significant positive/negative interaction between the effects of EM and V on the activity (black symbols) (p < 0.05, two-way ANOVA). C, Fractional change in percentage MR signal, (VEM − V)/V, indicating the effective change in fMRI activity caused by FEF-EM relative to the visual-only activation level. In all panels, error bars indicate 1 SEM across epochs; some error bars are smaller than the symbol used.
Figure 5.
Figure 5.
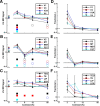
Modulation of contrast response functions in multiple visual areas by microstimulation of the FEF. A–C, The difference in fMRI activity between the VEM and V conditions at each contrast level (Fig. 4B; area V1 is repeated here for comparative purposes) for the 12 areas defined in Figure 3. Filled/open squares below the traces indicate a significant positive/negative interaction between factors EM and V relative to the 0% values (p < 0.05; two-way ANOVA). D–F, Fractional change in percentage MR signal [(VEM − V)/V]. In all panels, error bars indicate 1 SEM across epochs.
Figure 6.
Figure 6.
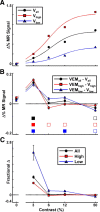
Contrast response functions for weakly and strongly visually driven voxels and their modulation by FEF microstimulation. A, Mean percentage change in MR signal for the V conditions as a function of contrast, across both subjects and all visual voxels in the 12 visual areas defined in Figure 4. Areas with more active voxels are weighted more. Vall represents all visual voxels (p < 0.05, uncorrected). Vhigh represents the best visually driven voxels (p < 0.05, corrected). Vlow represents all remaining voxels from the visual voxels pool not included in Vhigh (0.05, corrected < p < 0.05, uncorrected); on the cortical surface, these voxels are primarily located in annuli surrounding the best-driven population. The smooth curves show the best-fitting Naka–Rushton functions. B, Mean difference between VEM and V conditions. Filled/open squares below the traces indicate a significant positive/negative interaction between factors EM and V (p < 0.05, two-way ANOVA). C, Fractional change in percentage MR signal. In all panels, error bars indicate 1 SEM across epochs.
Figure 7.
Figure 7.
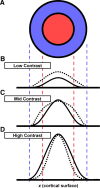
Schematic summary of the effect of FEF-EM. A, The concentric circles correspond to regions on the two-dimensional cortical surface representation of a visual stimulus (compare with Fig. 1D). Red/blue match the well/less well driven populations of visual voxels. B–D, Projecting this surface to one dimension yields three different activity profiles, depending on the stimulus contrast used (solid curve represents visual-only activation, and dotted curve the combined response to visual stimulation and FEF-EM).

References

    1. Albrecht DG, Hamilton DB. Striate cortex of monkey and cat: contrast response function. J Neurophysiol. 1982;48:217–237. - PubMed
    1. Armstrong KM, Moore T. Rapid enhancement of visual cortical response discriminability by microstimulation of the frontal eye field. Proc Natl Acad Sci U S A. 2007;104:9499–9504. - PMC - PubMed
    1. Armstrong KM, Fitzgerald JK, Moore T. Changes in visual receptive fields with microstimulation of frontal cortex. Neuron. 2006;50:791–798. - PubMed
    1. Armstrong-James M, Fox K. Spatiotemporal convergence and divergence in the rat S1 “barrel” cortex. J Comp Neurol. 1987;263:265–281. - PubMed
    1. Bartlett JR, DeYoe EA, Doty RW, Lee BB, Lewine JD, Negrão N, Overman WH., Jr Psychophysics of electrical stimulation of striate cortex in macaques. J Neurophysiol. 2005;94:3430–3442. - PubMed

Publication types

LinkOut - more resources