. 2009 Aug 26;29(34):10750-63.
doi: 10.1523/JNEUROSCI.2178-09.2009.

Dynamic associations in the cerebellar-motoneuron network during motor learning

Affiliations

Dynamic associations in the cerebellar-motoneuron network during motor learning

Raudel Sánchez-Campusano et al. J Neurosci. .

Abstract

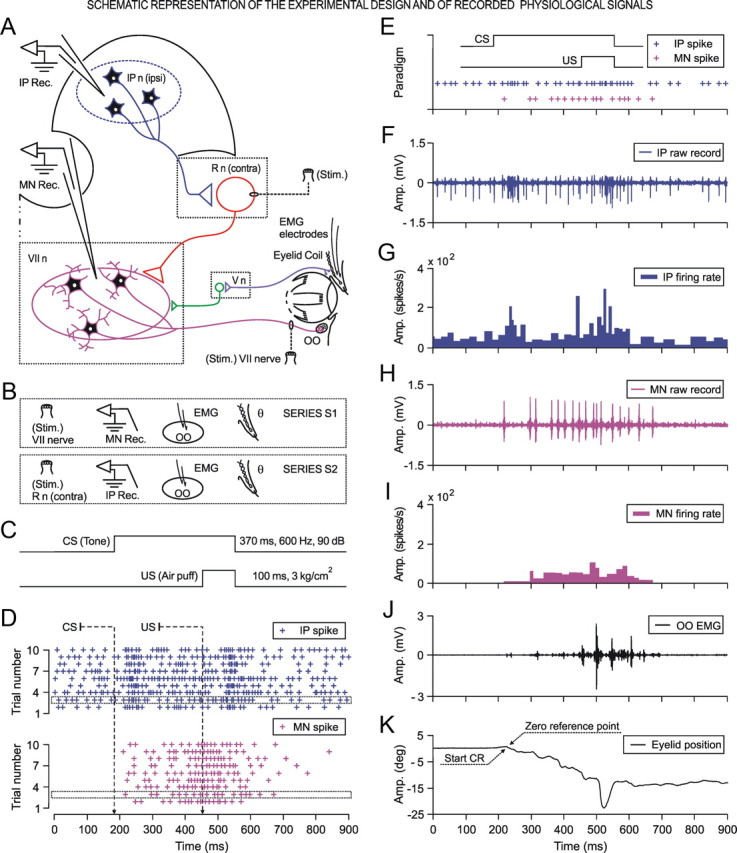
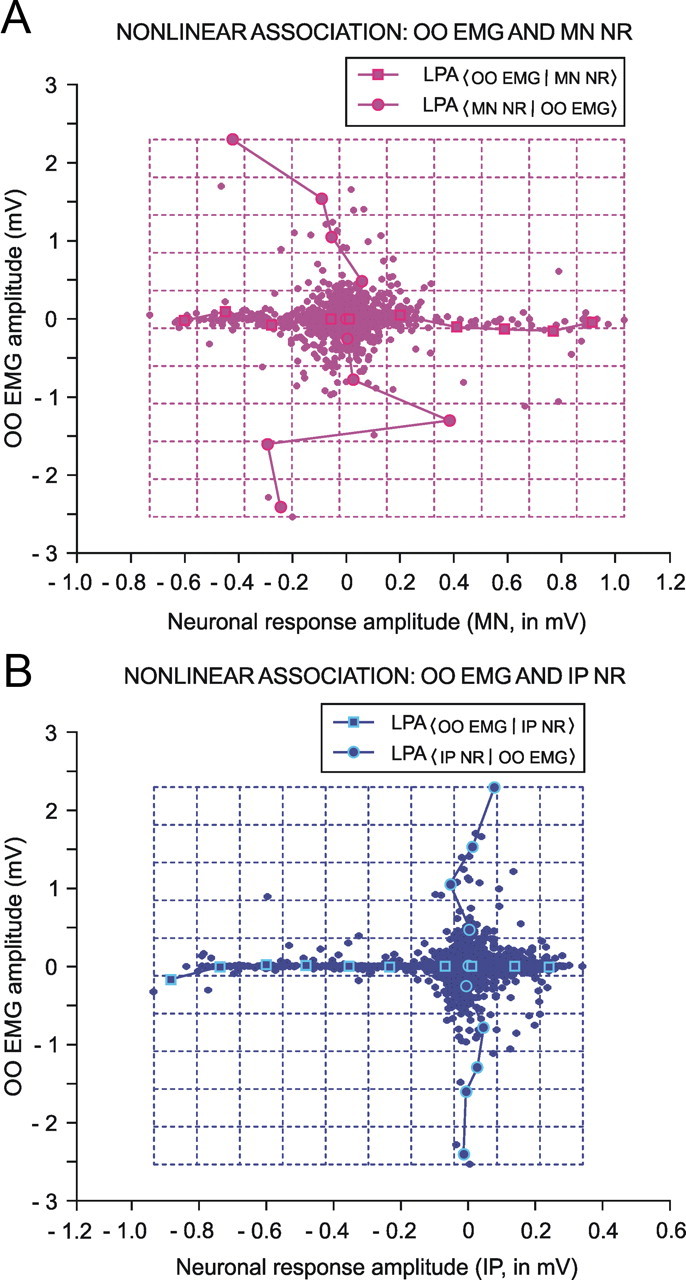
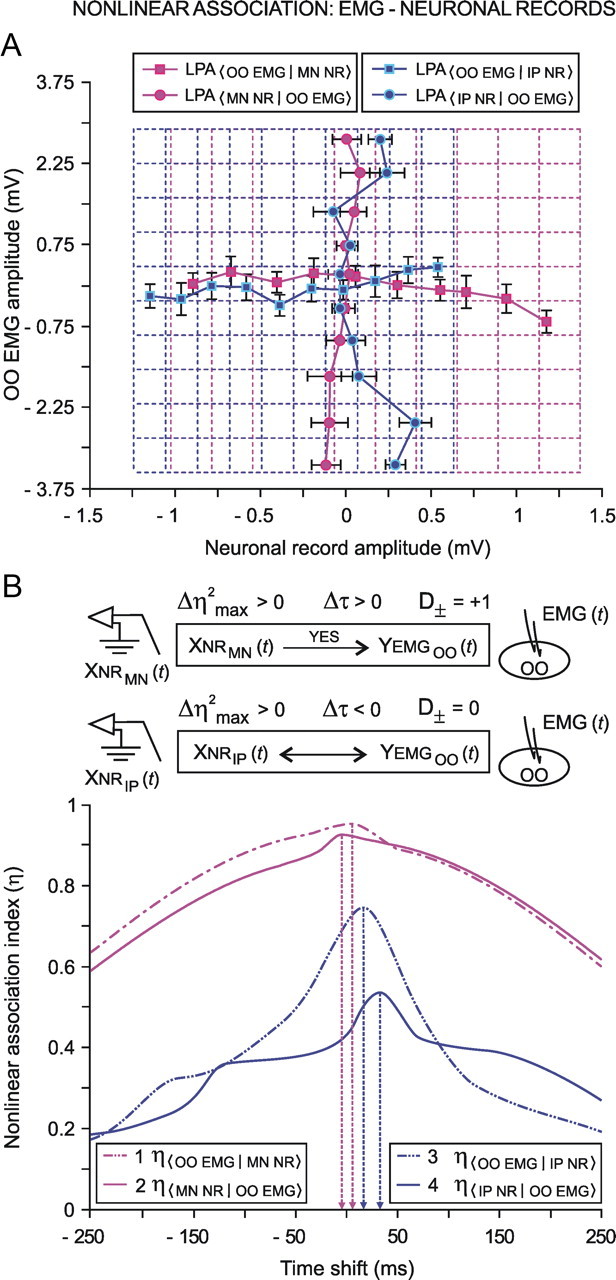
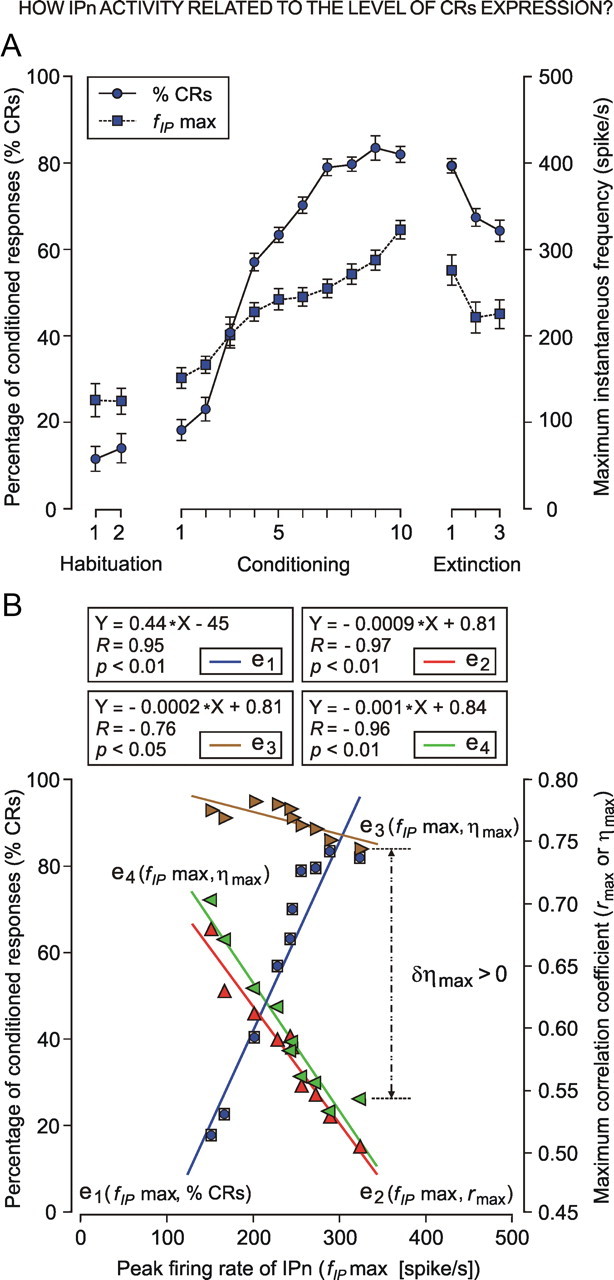
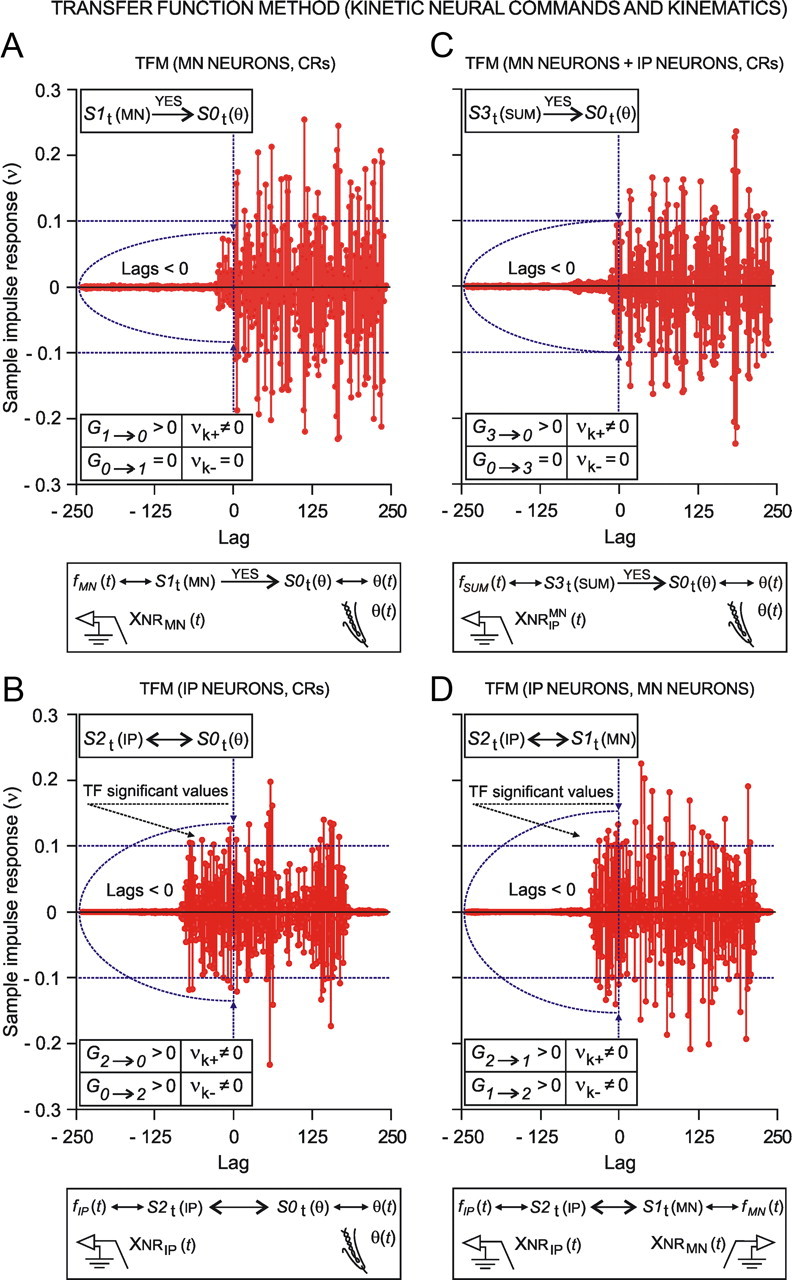
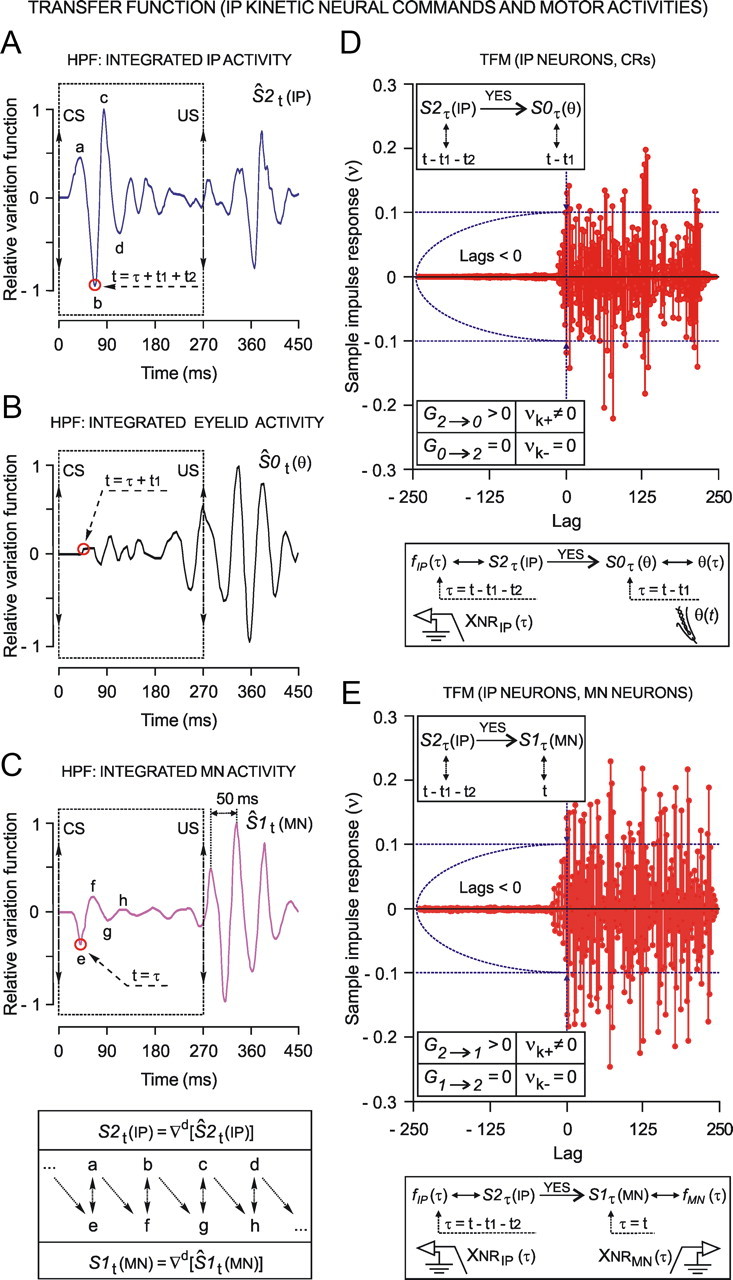
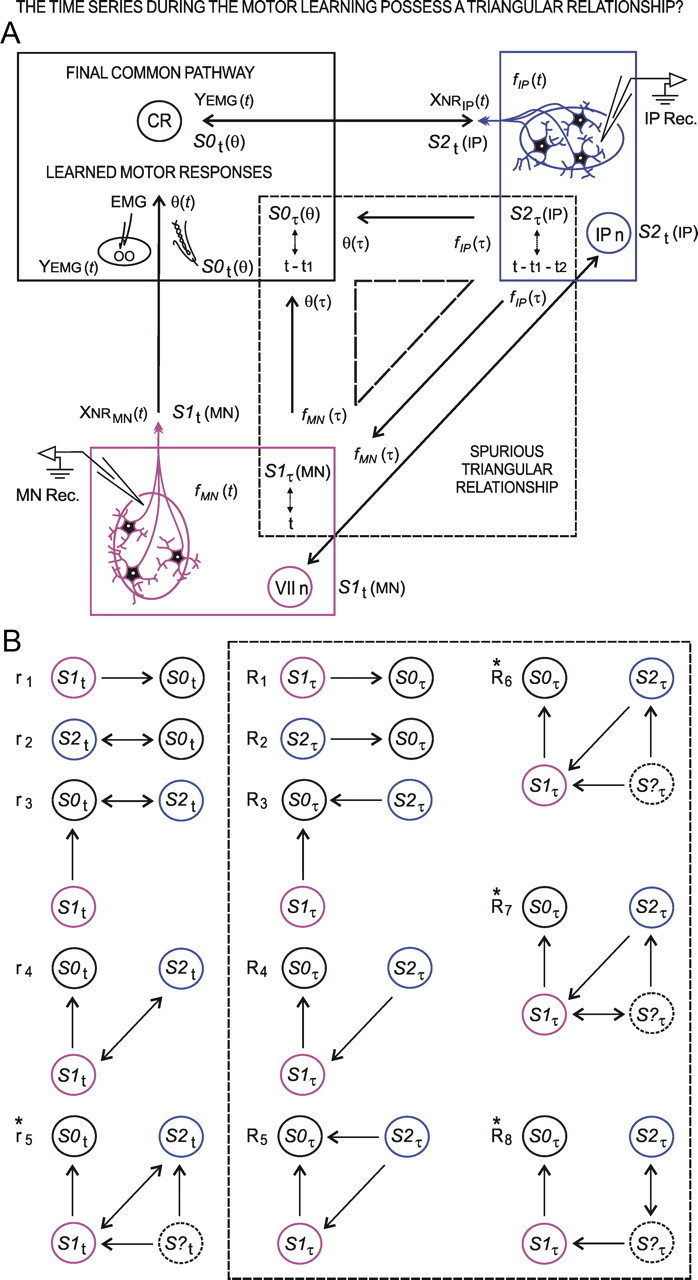
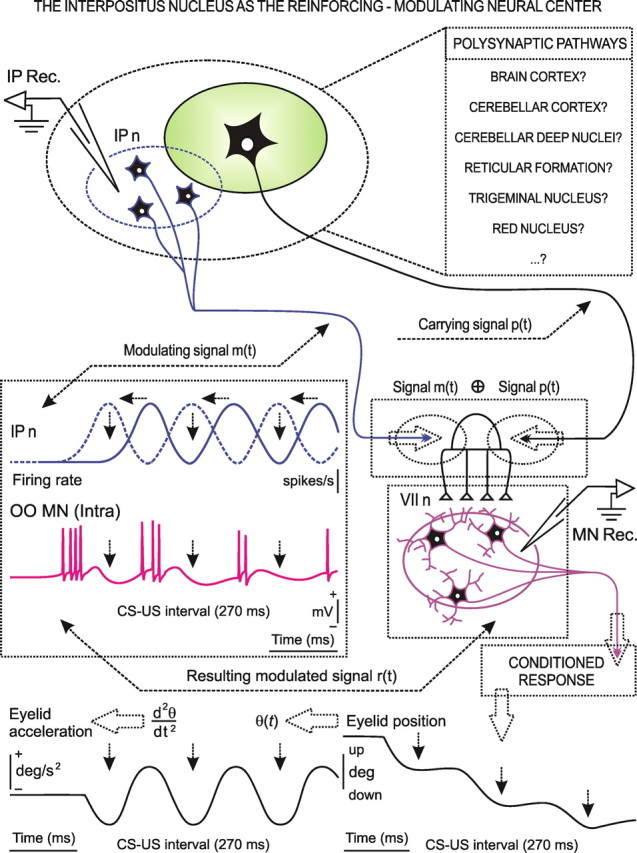
We assessed here true causal directionalities in cerebellar-motoneuron (MN) network associations during the classical conditioning of eyelid responses. For this, the firing activities of identified facial MNs and cerebellar interpositus (IP) nucleus neurons were recorded during the acquisition of this type of associative learning in alert behaving cats. Simultaneously, the eyelid conditioned response (CR) and the EMG activity of the orbicularis oculi (OO) muscle were recorded. Nonlinear association analysis and time-dependent causality method allowed us to determine the asymmetry, time delays, direction in coupling, and functional interdependences between neuronal recordings and learned motor responses. We concluded that the functional nonlinear association between the IP neurons and OO muscle activities was bidirectional and asymmetric, and the time delays in the two directions of coupling always lagged the start of the CR. Additionally, the strength of coupling depended inversely on the level of expression of eyeblink CRs, whereas causal inferences were significantly dependent on the phase information status. In contrast, the functional association between OO MNs and OO muscle activities was unidirectional and quasisymmetric, and the time delays in coupling were always of opposed signs. Moreover, information transfer in cerebellar-MN network associations during the learning process required a "driving common source" that induced the mere "modulating coupling" of the IP nucleus with the final common pathway for the eyelid motor system. Thus, it can be proposed that the cerebellum is always looking back and reevaluating its own function, using the information acquired in the process, to play a modulating-reinforcing role in motor learning.


Figures

Figure 1.
Figure 1.
Schematic representation of the experimental design and of recorded physiological signals. A, Diagram illustrating the stimulating (Stim.) and recording (Rec.) sites, as well as the eyelid coil and EMG electrodes implanted in the upper eyelid. Kinetic neuronal commands were computed from the firing activities of antidromically identified OO MNs located in the facial nucleus (VII n) and from neurons located in the ipsilateral cerebellar posterior IP nucleus (IP n). R n, red nucleus; V n, trigeminal nucleus. B, Diagrammatic representation of the experimental series (S1 for MN and S2 for IP neuron recordings, both obtained in simultaneity with the EMG activities of the OO muscle and eyelid position recordings) during classical eyeblink conditioning. C, For classical conditioning of eyelid responses we used a delay paradigm consisting of a tone as a CS. The CS started before but coterminated with an air puff used as an US. D–K, A set of recordings collected from the 10th conditioning session from two representative animals. D, Raster representation of action potentials generated by two identified neurons (an IP and an MN) across one learning block (n = 9 trials). Each row in the raster represents a single trial. The two single trials marked with dotted rectangles in D correspond to the global representation of collected physiological signals illustrated from E to K. E, Conditioning paradigm and firing activities of two (IP and MN) selected neurons during a single trial. Action potentials (IP spikes), marked with blue plus signs (D and E), correspond to the direct representation of the neuronal activity in the IP n (IP raw recordings, in F), and its respective instantaneous frequency (IP firing rate, in G). Action potentials (MN spikes) recorded from an OO MN are indicated with magenta plus signs (D and E) and are the direct representation of the neuronal activity in the facial nucleus (MN raw recordings, in H) and its corresponding instantaneous frequency (MN firing rate, in I). J, K, These traces illustrate the EMG activity of the OO muscle (OO EMG, in J), and the direct recording of the eyelid position by the magnetic field search-coil technique (in K). The beginning of the CR was taken as the zero reference point (in K) for subsequent analysis.
Figure 2.
Figure 2.
A scatter representation of motoneuronal (MN NR, in A) and IP neuronal (IP NR, in B) responses versus the EMG activity of the OO muscle (OO EMG). A, An LPA of the nonlinear regression curves was obtained by representing the scatter plot of OO EMG amplitude (in mV) versus the amplitude of motoneuronal responses (in mV) divided by segments of straight lines. The subdivisions in amplitude bins (Nb = 10, i.e., a total of 11 vertical and horizontal magenta lines) are shown for the association between MN recordings and the OO EMG activity. Illustrated results correspond to a single trial and to data collected from Figure 1J (for OO EMG) and Figure 1H (for MN NR) of the main text. B, The same as in A but relating IP neuronal (IP NR) responses versus OO EMG. Illustrated results correspond to data collected from Figure 1J (for OO EMG) and Figure 1F (for IP NR) of the main text.
Figure 3.
Figure 3.
A representation of the nonlinear association method applied to the EMG activity of the OO muscle (OO EMG) and facial motoneuron (MN NR) or IP neuron (IP NR) responses. Two recorded neurons were selected from each of the experimental subjects collected from the 10th conditioning session (series S1: C10, four cats, eight motoneurons; series S2: C10, four cats, eight IP neurons). A, Two pairs of LPAs of the nonlinear regression curves were obtained by representing the scatter plot of OO EMG amplitudes (in mV) versus neuronal recording amplitudes (in mV) by segments of straight lines. The subdivision in amplitude bins (Nb = 10; i.e., a total of 11 vertical and horizontal magenta and blue dashed lines) are shown for MN and IP neuronal associations with OO EMG activities (see color code in the legends). For each mean value per bin, the ± SEM is always indicated. B, The nonlinear association indices (η) were calculated between the two pairs of electrophysiological signals (in both senses) as functions of the time shift. The start of the eyelid CR is taken as the zero reference point of the dynamic association. Four nonlinear association curves are represented. Each representation corresponds to the average of all nonlinear association curves obtained for the trials presenting conditioned eyelid responses (n < 10) and collected from all the blocks (n = 12) of the same conditioning session (C10) for all the experimental subjects (n = 4). The vertical broken lines represent the time shifts for which the maximum values for nonlinear association indices are reached (time delays). In the first case (OO EMG vs MN NR, and vice versa), the information of asymmetry and the relative time delay in coupling were positive (Δη2max > 0, Δτ > 0, respectively), whereas the index of the directional coupling between the signals was equal to unity (D± = +1). In the second case (OO EMG vs IP NR and vice versa), the degree of asymmetry of the nonlinear coupling was positive (Δη2max > 0), and the relative time delay between the signals was negative (Δτ < 0), so that the direction index was annulled (D± = 0). In this case, the time delays are located to the right of the zero reference point (i.e., always lagged the start of CR).
Figure 4.
Figure 4.
Relationships between type A IP neuron (IPn) firing rates and the percentage of CRs across the 10 conditioning sessions. A, Learning curve (blue circles; mean (± SEM) corresponding to all the animals (n = 4) of the experimental series S2). The mean (± SEM) firing rate of 96 identified IP neurons (blue squares) during the CS–US interval is also indicated. B, The abscissa and the left ordinate illustrate the relationship between the peak firing rate of IPn (fIPmax) and the percentage of CRs (blue squares; e1 regression line). The abscissa and the right ordinate illustrate the relationship between peak firing rate (fIPmax) and the coefficient of correlation (red triangles, rmax linear coefficients, e2 regression line; green triangles, ηmax nonlinear association coefficients) with eyelid performance during CRs, across conditioning. Note that the increase in fIPmax (e1 regression line) together with the decrease in its time of occurrence (always lagged the start of CR), caused a decrease in the rmax linear coefficient (see, e2 regression line) between instantaneous frequency fIP and eyelid CRs. In turn, a similar decrease was observed in the ηmax nonlinear coefficients (see, e3 regression line for ηmax[OO EMG vs IP NR]; and e4 regression line for ηmax[IP NR versus OO EMG]) between IP NR and the EMG activity of the OO muscle (OO EMG). Thus, the strength (strong or weak) of the functional nonlinear association depends inversely on the level of expression of conditioned eyeblink responses. Also, the degree of asymmetry of the nonlinear coupling was positive (Δη2max ≈ 0.26, with δηmax ≈ 0.20). The index R is the well-known Pearson's product moment correlation coefficient, i.e., the conventional index frequently used to measure the linear correlation between two variables (e.g., fIPmax vs % CRs; or fIPmax vs rmax; or fIPmax vs ηmax).
Figure 5.
Figure 5.
Causal inferences using TFM between the kinetic neuronal commands [neuronal activity of OO MNs and neuronal activity of cerebellar IP neurons (IP)] and kinematics (eyelid CRs). Three representative IP neurons and a representative motoneuron were selected from each experimental subject (n = 8) during the 10th conditioning session (series S1: C10, four cats, four MNs; series S2: C10, four cats, 12 IP neurons). A–D, The transfer function models assume that the stationary time series S1t(MN), S2t(IP), S3t(SUM), and S0t(θ) have a functional and dynamic relationship, implying that S0t(θ) depends on its own past and on the past of S1t(MN), S2t(IP), and S3t(SUM) (i.e., the causality indices are such that G1→0 > 0, G0→1 = 0, νk+ ≠ 0, and νk = 0, see A for a unidirectional coupling; G2→0 > 0, G0→2 > 0, νk+ ≠ 0, and νk ≠ 0, see B for a bidirectional coupling; G3→0 > 0, G0→3 = 0, νk+ ≠ 0, and νk = 0, see C for a unidirectional coupling, respectively). Note that S3t(SUM) depends only on its own past (i.e., G0→3 = 0) and that the unidirectional relationship in opposite direction (as shown in C) was possible because S1t(MN) and S2t(IP) were induced toward a phase equality (i.e., the relative phase difference will be close to zero). However, S1t(MN) depends on its own past and on the past of S2t(IP), and S2t(IP) depends on its own past and on the past of S1t(MN) (i.e., significant values of the causality indices in both senses: G2→1 > 0, G1→2 > 0, νk+ ≠ 0, and νk ≠ 0, see D for a bidirectional coupling), indicating a feedback relationship between these physiological time series, at least in the statistical sense of causality. Blue horizontal dashed lines indicate the approximate upper and lower confidence bounds (∼95% confidence interval), assuming that the input and output physiological time series are completely uncorrelated.
Figure 6.
Figure 6.
Causal inferences using TFM between IP kinetic neuronal commands (activity of IP neurons) and motor activities (activity of OO MNs and eyelid CRs), during the phase synchronization. A–C, High-pass filtering (HPF) of the integrated activity. Oscillatory curves (relative variation functions) resulting from HPF (−3 dB cutoff at 5 Hz and zero gain at 15 Hz) of integrated neuronal firing activities and of eyelid position corresponding to the same set of records. (The experimental data used here are the same as those used in Fig. 5). The operator ▿d allowed obtaining the stationary time series S1t(MN), S2t(IP), and S0t(θ) after making n = d regular differentiations to the nonstationary time series (i.e., the relative variation curves, as shown in A–C). Note that in the oscillating curves shown here, components a–d are totally out of phase with components e–h. The transfer function models (D and E) assume that the stationary time series possess a direct interdependence after phase synchronization [i.e., the phases corresponding to τ = tt1t2, for S2τ(IP), τ = tt1, for S0τ(θ), and τ = t, for S1τ(MN)], implying that S0τ(θ) depends on its own past and on the past of S2τ(IP) (i.e., the indices are such that G2→0 > 0, G0→2 = 0, νk+ ≠ 0, and νk = 0; see D for a unidirectional coupling); and that S1τ(MN) depends on its own past and on the past of S2τ(IP) (i.e., G2→1 > 0, G1→2 = 0, νk+ ≠ 0, and νk = 0, see E for another unidirectional coupling). Blue horizontal dashed lines in D and E indicate the approximate upper and lower confidence bounds (∼95% confidence interval), assuming the input and output physiological time series are completely uncorrelated.
Figure 7.
Figure 7.
A, Diagrammatic representation of the causal inferences among the two neuronal time series [the OO MNs (see VII n inside the magenta rectangle) and the cerebellar IP neurons (see IP n inside the blue rectangle)] and the eyelid time series in the final common pathway for performance of learned motor responses (see CR, in the black rectangle). For each of the causal inferences represented, the implied physiological series and the respective temporal dependence (t or τ) are indicated. B, Causal relationships before (ri, in the instants t) and after (Ri, in the instants τ) phase synchronization. The relationship r1 represents a unidirectional linear model with a flow of S1t(MN)→S0t(θ); r2 a bidirectional model with flows S2t(IP)⇄S0t(θ); r3 a unidirectional linear model [S1t(MN)→S0t(θ)] with additional feedback [S2t(IP)⇄S0t(θ)]; r4 a unidirectional linear model [S1t(MN)→S0t(θ)] with additional feedback [S2t(IP)⇄S1t(MN)]; and r5 a combination between a unidirectional linear relationship [S1t(MN)→S0t(θ)] and a bidirectional model with a common source S?t [S?tS1t(MN), S?tS2t(IP), and S1t(MN)⇄S2t(IP)]. After phase synchronization (dashed-line rectangle in A and B), R1 represents a unidirectional linear model with a flow of S1τ(MN)→. S0τ(θ); R2 a unidirectional linear model with a flow of S2τ(IP)→S0τ(θ); R3 a closed semilinear model with flows S1τ(MN)→S0τ(θ) and S2τ(IP)→S0τ(θ); and R4 a unidirectional multilinear model with flows S2τ(IP)→S1τ(MN)→S0τ(θ). R5 represents a triangular relationship [nonlinear model with flows S2τ(IP)→S1τ(MN), S1τ(MN)→S0τ(θ), and S2τ(IP)→S0τ(θ), see dashed-line triangle in A] but with spurious causality [closed semilinear (R3) and unidirectional multilinear (R4) models cannot coexist]. However, in the r5, R6, R7, and R8 causal relationships, the mathematical linear coupling of r2 and R2 vanishes and the closed semilinear (r3 and R3) and nonlinear (R5) models were rejected. Finally, the putative causal inferences depended on a common source (see S?t or S?τ, in the relationships marked with an asterisk) in open nonlinear (r5, R6, or R7) or linear (R8) models such as those represented here. The causal relationships marked with an asterisk correspond to the best candidates to explain the coupling relationships in IP neuron-facial MN circuits involved in the dynamic control of conditioned eyelid responses.
Figure 8.
Figure 8.
Schematic representation of the reinforcing-modulating role of cerebellar posterior IP neurons during the acquisition of an associative learning task. Neuronal inputs arriving at the facial nucleus (OO MNs) and carrying conditioned signals p(t) need the reinforcing-modulating role of deep cerebellar nuclei signals m(t). To be efficient, IP neuronal signals need to go through a learning process to become 180° out-of-phase OO MN firing. Thus, IP neuronal activities (following a relay in the red nucleus) reach OO MNs right at the moment of maximum motoneuronal hyperpolarization (Trigo et al., 1999), and IP neurons facilitate a quick repolarization of OO MNs, reinforcing their tonic firing during the performance of classically conditioned eyelid responses. VII n, facial nucleus; IP n, cerebellar posterior IP nucleus.

Similar articles

Cited by

References

    1. Ansari-Asl K, Senhadji L, Bellanger JJ, Wendling F. Quantitative evaluation of linear and nonlinear methods characterizing interdependencies between brain signals. Phys Rev E Stat Nonlin Soft Matter Phys. 2006;74:31916/1–13. - PMC - PubMed
    1. Aou S, Woody CD, Birt D. Changes in the activity of units of the cat motor cortex with rapid conditioning and extinction of a compound eyeblink movement. J Neurosci. 1992;12:549–559. - PMC - PubMed
    1. Belsley DA, Kuh E, Welsch RE. Regression diagnostics: identifying influential data and sources of collinearity. New York: Wiley; 1980.
    1. Berman AL. The brain stem of the cat: a cytoarchitectonic atlas with stereotaxic coordinates. Madison, WI: University of Wisconsin; 1968.
    1. Bernasconi C, Von Stein A, Chiang C, Konig P. Bidirectional interactions between visual areas in the awake behaving cat. Neuroreport. 2000;11:689–692. - PubMed

Publication types

LinkOut - more resources