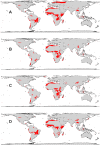
Integrating economic costs and biological traits into global conservation priorities for carnivores
- PMID: 19710911
- PMCID: PMC2728536
- DOI: 10.1371/journal.pone.0006807
Integrating economic costs and biological traits into global conservation priorities for carnivores
Abstract
Background: Prioritization schemes usually highlight species-rich areas, where many species are at imminent risk of extinction. To be ecologically relevant these schemes should also include species biological traits into area-setting methods. Furthermore, in a world of limited funds for conservation, conservation action is constrained by land acquisition costs. Hence, including economic costs into conservation priorities can substantially improve their conservation cost-effectiveness.
Methodology/principal findings: We examined four global conservation scenarios for carnivores based on the joint mapping of economic costs and species biological traits. These scenarios identify the most cost-effective priority sets of ecoregions, indicating best investment opportunities for safeguarding every carnivore species, and also establish priority sets that can maximize species representation in areas harboring highly vulnerable species. We compared these results with a scenario that minimizes the total number of ecoregions required for conserving all species, irrespective of other factors. We found that cost-effective conservation investments should focus on 41 ecoregions highlighted in the scenario that consider simultaneously both ecoregion vulnerability and economic costs of land acquisition. Ecoregions included in priority sets under these criteria should yield best returns of investments since they harbor species with high extinction risk and have lower mean land cost.
Conclusions/significance: Our study highlights ecoregions of particular importance for the conservation of the world's carnivores defining global conservation priorities in analyses that encompass socioeconomic and life-history factors. We consider the identification of a comprehensive priority-set of areas as a first step towards an in-situ biodiversity maintenance strategy.
Conflict of interest statement
Figures


Similar articles
-
Hung out to dry: choice of priority ecoregions for conserving threatened neotropical anurans depends on life-history traits.PLoS One. 2008 May 7;3(5):e2120. doi: 10.1371/journal.pone.0002120. PLoS One. 2008. PMID: 18461175 Free PMC article.
-
Conserving biodiversity efficiently: what to do, where, and when.PLoS Biol. 2007 Sep;5(9):e223. doi: 10.1371/journal.pbio.0050223. PLoS Biol. 2007. PMID: 17713985 Free PMC article.
-
Global priorities for national carnivore conservation under land use change.Sci Rep. 2016 Apr 1;6:23814. doi: 10.1038/srep23814. Sci Rep. 2016. PMID: 27034197 Free PMC article.
-
Integrating economic costs into conservation planning.Trends Ecol Evol. 2006 Dec;21(12):681-7. doi: 10.1016/j.tree.2006.10.003. Epub 2006 Oct 16. Trends Ecol Evol. 2006. PMID: 17050033 Review.
-
A review of financial instruments to pay for predator conservation and encourage human-carnivore coexistence.Proc Natl Acad Sci U S A. 2011 Aug 23;108(34):13937-44. doi: 10.1073/pnas.1012972108. Epub 2011 Aug 22. Proc Natl Acad Sci U S A. 2011. PMID: 21873181 Free PMC article. Review.
Cited by
-
Foraging habitat quality constrains effectiveness of artificial nest-site provisioning in reversing population declines in a colonial cavity nester.PLoS One. 2013;8(3):e58320. doi: 10.1371/journal.pone.0058320. Epub 2013 Mar 6. PLoS One. 2013. PMID: 23484016 Free PMC article.
-
Conservation priorities for Prunus africana defined with the aid of spatial analysis of genetic data and climatic variables.PLoS One. 2013;8(3):e59987. doi: 10.1371/journal.pone.0059987. Epub 2013 Mar 27. PLoS One. 2013. PMID: 23544118 Free PMC article.
-
A comprehensive quantitative assessment of bird extinction risk in Brazil.PLoS One. 2013 Aug 12;8(8):e72283. doi: 10.1371/journal.pone.0072283. eCollection 2013. PLoS One. 2013. PMID: 23951302 Free PMC article.
-
Behavioral Correlates of Primates Conservation Status: Intrinsic Vulnerability to Anthropogenic Threats.PLoS One. 2015 Oct 7;10(10):e0135585. doi: 10.1371/journal.pone.0135585. eCollection 2015. PLoS One. 2015. PMID: 26444966 Free PMC article.
-
Understanding the local socio-political processes affecting conservation management outcomes in Corbett Tiger Reserve, India.Environ Manage. 2014 May;53(5):913-29. doi: 10.1007/s00267-014-0248-4. Epub 2014 Feb 13. Environ Manage. 2014. PMID: 24522894
References
-
- Margules CR, Pressey RL. Systematic conservation planning. Nature. 2000;405:243–253. - PubMed
-
- Margules CR, Sarkar S. Cambridge: Cambridge University Press; 2007. Systematic conservation planning.278
-
- Cowling RM, Pressey RL, Rouget M, Lombard AT. A conservation plan for a global biodiversity hotspot - the Cape Floristic Region, South Africa. Biol Conserv. 2003;112:191–216.
-
- Smith RJ, Goodman PS, Matthews WS. Systematic conservation planning: a review of perceived limitations and an illustration of the benefits, using a case study from Maputaland, South Africa. Oryx. 2006;40:400–410.
-
- Loyola RD, Kubota U, Lewinsohn TM. Endemic vertebrates are the most effective surrogates for identifying conservation priorities among Brazilian ecoregions. Divers Distrib. 2007;13:389–396.
Publication types
MeSH terms
LinkOut - more resources
Full Text Sources

