. 2010 Mar 15;126(6):1339-52.
doi: 10.1002/ijc.24859.

Stromal cell-derived CSF-1 blockade prolongs xenograft survival of CSF-1-negative neuroblastoma

Affiliations

Stromal cell-derived CSF-1 blockade prolongs xenograft survival of CSF-1-negative neuroblastoma

Dietmar Abraham et al. Int J Cancer. .

Abstract

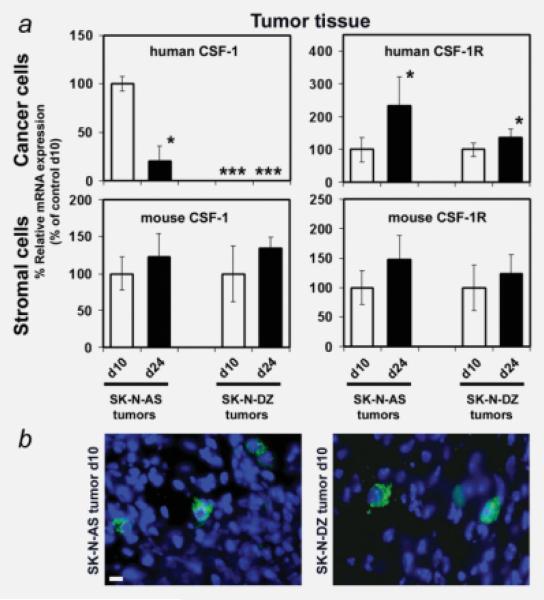
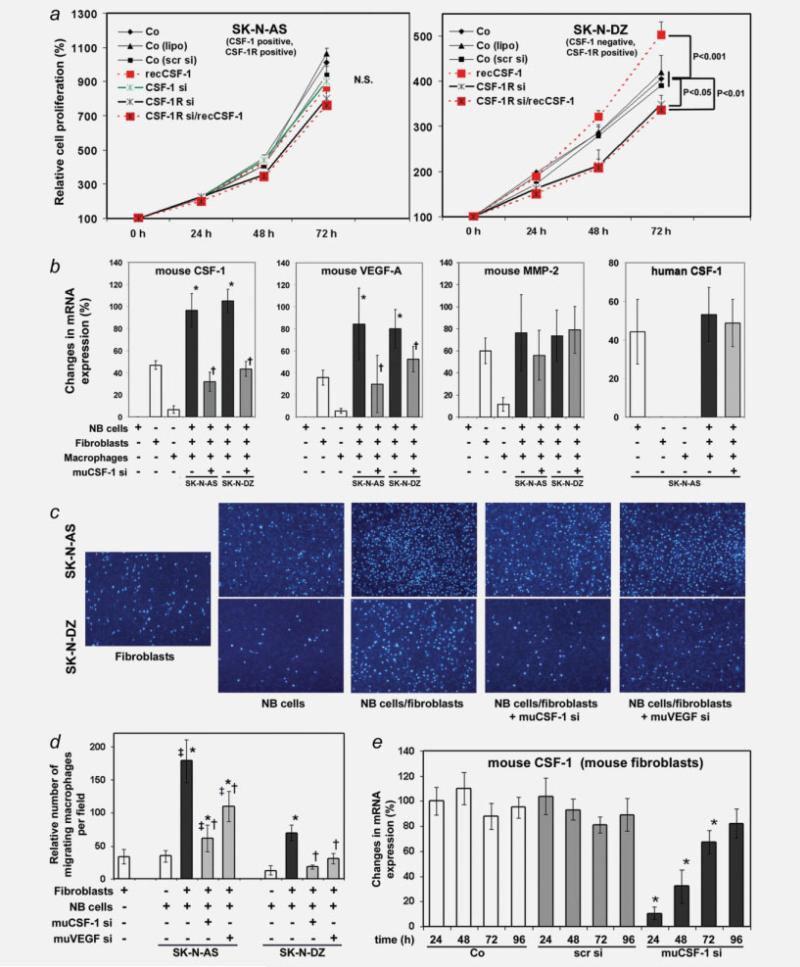
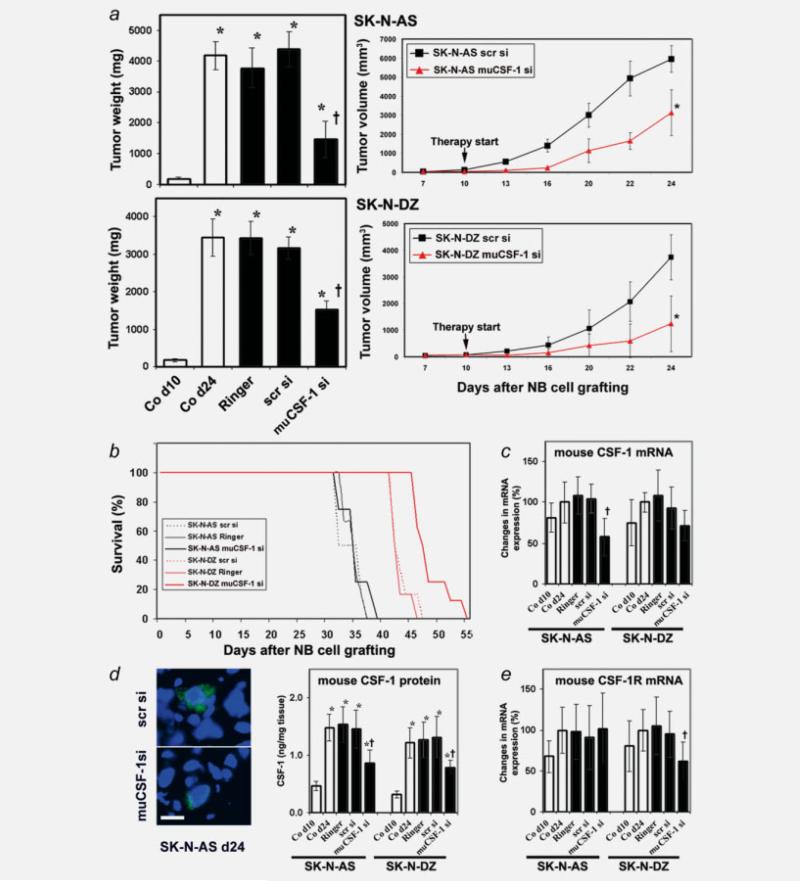
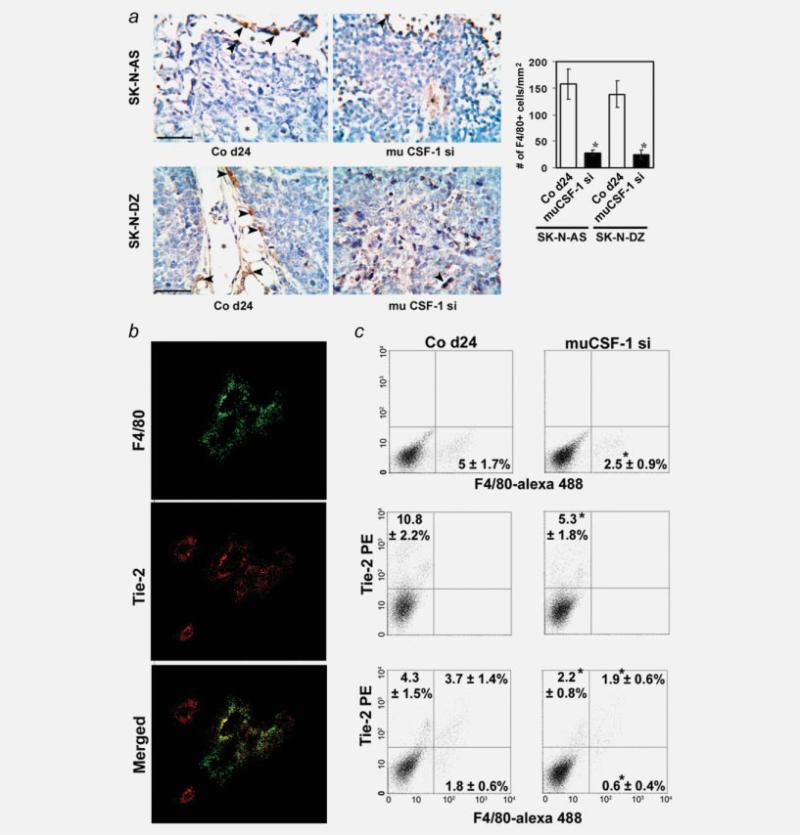
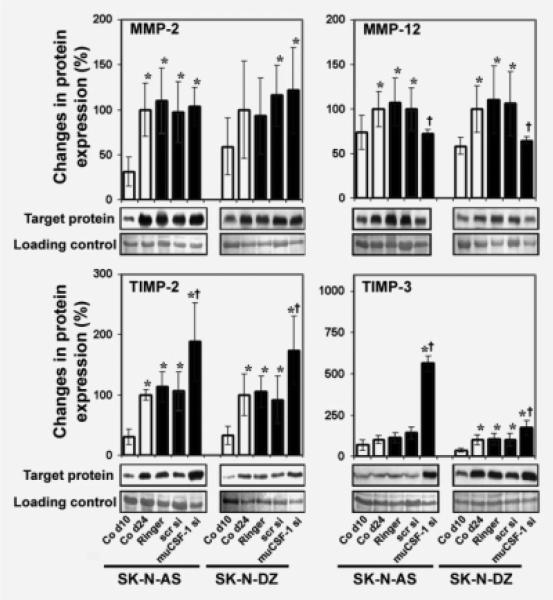
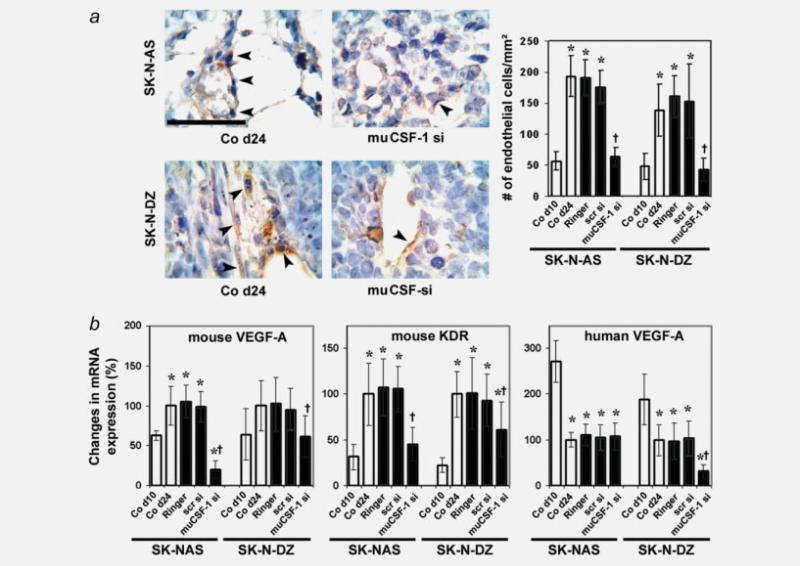
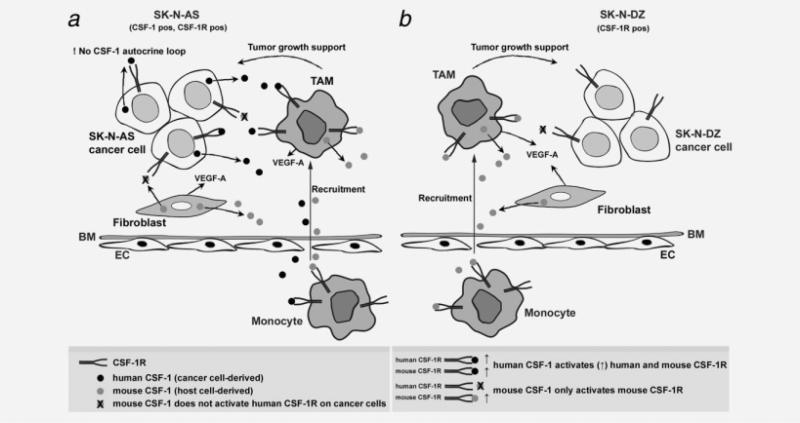
The molecular mechanisms of tumor-host interactions that render neuroblastoma (NB) cells highly invasive are unclear. Cancer cells upregulate host stromal cell colony-stimulating factor-1 (CSF-1) production to recruit tumor-associated macrophages (TAMs) and accelerate tumor growth by affecting extracellular matrix remodeling and angiogenesis. By coculturing NB with stromal cells in vitro, we showed the importance of host CSF-1 expression for macrophage recruitment to NB cells. To examine this interaction in NB in vivo, mice bearing human CSF-1-expressing SK-N-AS and CSF-1-negative SK-N-DZ NB xenografts were treated with intratumoral injections of small interfering RNAs directed against mouse CSF-1. Significant suppression of both SK-N-AS and SK-N-DZ NB growth by these treatments was associated with decreased TAM infiltration, matrix metalloprotease (MMP)-12 levels and angiogenesis compared to controls, while expression of tissue inhibitors of MMPs increased following mouse CSF-1 blockade. Furthermore, Tie-2-positive and -negative TAMs recruited by host CSF-1 were identified in NB tumor tissue by confocal microscopy and flow cytometry. However, host-CSF-1 blockade prolonged survival only in CSF-1-negative SK-N-DZ NB. These studies demonstrated that increased CSF-1 production by host cells enhances TAM recruitment and NB growth and that the CSF-1 phenotype of NB tumor cells adversely affects survival.


Figures

Figure 1
Figure 1
(a) CSF-1 and CSF-1 receptor expression changes in the growing tumor. Quantitative RT-PCR mRNA measurements of human CSF-1, human CSF-1R, mouse CSF-1 and mouse CSF-1R in SK-N-AS and SK-N-DZ tumor lysates were performed on days 10 and 24 following tumor cell xenografting. *, Significantly different from tumor on day 10 (d10; SK-N-AS, p < 0.001; SK-N-DZ, p < 0.01); ***, mRNA not detectable. (b) Representative immunohistochemical images of SK-N-AS (left) and SK-N-DZ (right) day 10 tumor tissue sections stained with antibody against mouse CSF-1. Alexa-488 fluorescence indicates mouse (host) CSF-1-positive stromal cells. Nuclei are counterstained with DAPI (scale bar: 10 μm).
Figure 2
Figure 2
(a) Effects of CSF-1 and CSF-1R on SK-N-AS and SK-N-DZ cell proliferation. Relative cell densities of NB cells up to 72 hr following treatment with recombinant huCSF-1 (recCSF-1), siRNA against huCSF-1 (CSF-1 si) and huCSF-1R (CSF-1R si) and a combination of huCSF-1R siRNA (CSF-1R si) and recombinant huCSF-1 (recCSF-1) were measured using the WST-1 reagent. Control cells (Co) were untreated, treated with Lipofectamine (lipo) or scrambled siRNA (scr-si). *, p < 0.01, significantly different from control (co). (b) Cancer cell–stromal cell interactions upregulate stromal cell gene expression. SK-N-AS or SK-N-DZ cancer cells were cocultured with mouse CRL-2470 macrophages and mouse S3T3 fibroblasts. Mouse CSF-1, VEGF-A, MMP-2 and human CSF-1 mRNA expression were measured by real-time RT-PCR in RNA from cultured cells alone or from cocultured human NB cancer cells and mouse macrophages and fibroblasts following treatment with or without mouse CSF-1 siRNA (muCSF-1-si). Results were normalized to human and mouse β-2 microglobulin mRNA levels, respectively, and expressed as relative changes in mRNA expression (mean ± SD). *, Significantly different from cultured mouse fibroblasts and macrophages (p < 0.001); †, Significantly different from cocultured NB cells, fibroblasts and macrophages (p < 0.001 for mouse CSF-1 and p < 0.01 for mouse VEGF-A). (c, d) Fibroblast-derived CSF-1 and VEGF-A promote macrophage migration. Representative images (c) and quantification (d) of migrated macrophages from an in vitro migration assay. Macrophage cell migration to cultured fibroblasts, SK-N-AS or SK-N-DZ NB cells or cocultured NB cells/fibroblasts treated with or without muCSF-1 siRNA (muCSF-1 si) and siRNA against mouse VEGF-A (muVEGF si) was measured in a Boyden incubation chamber. Data were collected from 5 individual consecutive fields of view (×10) from 3 replicate Boyden chambers. *, Significantly different from cultured fibroblasts and NB cells (p < 0.001); †, Significantly different from cocultured NB cells/fibroblasts (p < 0.001) ‡, significantly different from SK-N-DZ cocultures (p < 0.001). (e) siRNA directed against mouse CSF-1 down-regulates target gene expression in mouse S3T3 fibroblasts as determined in cell lysates by real-time reverse transcription-PCR. CSF-1 mRNA expression decreases significantly up to 72 hr following treatment with 100 nM mouse CSF-1 siRNA (muCSF-1 si) as compared to scrambled siRNA (scr si) and untreated control (Co). *, Significantly different from controls and scrambled siRNA (p < 0.001 for 24 and 48 hr and p = 0.016 for 72 hr).
Figure 3
Figure 3
muCSF-1 siRNAs suppresses NB growth in mice. (a) Left panel: mean NB xenograft weights of human SK-N-AS (upper histogram) and SK-N-DZ NB (lower histogram) xenografts in control mice on day 10 (Co d10; therapy start), in control mice on day 24 (Co d24; therapy end), in control mice treated with Ringer's solution on day 24 (Ringer) and in mice treated with scrambled siRNA (scr si), or muCSF-1 siRNA (muCSF-1 si). *, Significantly different from Co d10 (p < 0.001); †, Significantly different from Co d24, Ringer and scr si (p < 0.001). Right panel: tumor volume of SK-N-AS and SK-N-DZ NB xenografts in control mice (treated with scrambled siRNA; scr si) and in mice treated with muCSF-1 siRNA (muCSF-1 si) from day 7 to day 24. *, Significantly different from scr si (p < 0.001); ***, not detectable. (b) Survival of mice with NB xenografts. Survival is increased significantly in SK-N-DZ-bearing mice after treatment with muCSF-1 siRNA (SK-N-DZ muCSF-1 si; p = 0.002 and p = 0.004 vs. Ringer's solution-treated [SK-N-DZ Ringer] and scrambled siRNA-treated [SK-N-DZ scr si] mice, respectively), but not in SK-N-AS bearing mice vs. control animals. At day 46, when the last animal of the SK-N-DZ control group had died, 50% of the muCSF-1 siRNA-treated mice were still alive. (c–e) muCSF-1 siRNA downregulates expression of target molecules in vivo. (c) Quantitative muCSF-1 mRNA measurements by real-time RT-PCR. (d) Left panel: representative immunohistochemical images of SK-N-AS day 24 tumor tissue sections stained with antibody against mouse CSF-1. Alexa-488 fluorescence indicates mouse (host) CSF-1-positive stromal cells. Nuclei are counterstained with DAPI (scale bar: 10 μm); right panel: quantitative protein measurements by muCSF-1 RIA. (e) Quantitative RT-PCR measurements of muCSF-1R mRNA in tumor lysates of mice xenografted with SK-N-AS and SK-N-DZ NB cells. *, Significantly different from Co d10 (p < 0.003 in panel a; p < 0.005 in panel d); †, Significantly different from Co d24, Ringer and scr si (p = 0.005 in panel a; p < 0.009 in panel c; and p < 0.03 in panels d and e).
Figure 4
Figure 4
Invasion of Tie-2-positive and -negative macrophages is reduced by host CSF-1 blockade in SK-N-AS and SK-N-DZ NB xenografts. (a) Left panels: representative immunohistochemistry images of tumor tissue sections in a control mouse on day 24 (Co d24) and in mice treated with muCSF-1 siRNA (muCSF-1 si) stained with antibody to the mouse macrophage marker protein F4/80. Arrows indicate TAMs staining positively with F4/80 antibody that lines vascular channels (asterisk), some of which contain blood cells. Calibration bar = 50 μm. Right panel: results of a quantitative histomorphometric analysis showing the density of F4/80-positive cells. *, Significantly different from Co d24 (p < 0.001). (b) Localization of TAMs and endothelial cells in SK-N-AS NB xenografts. Confocal images of cells immunostained with anti-F4/80 rat monoclonal antibody specific for macrophages (green fluorescence), or with anti-Tie-2 (red fluorescence). An overlay of F4/80 and Tie-2 staining shows localization of F4/80 cells to blood vessels as well as colocalization of F4/80 and Tie-2, indicating that Tie-2-positive macrophages line the tumor vessels. Also shown are areas that stain with Tie-2 alone, outlining endothelial cell-lined vessels. Scale bar = 50 μm. (c) Representative images and quantification of the number of F4/80- and Tie-2-positive cells in day 24 SK-N-AS NB tissue from the untreated control group (left panels) and from mice treated with anti-mouse CSF-1 si RNA (muCSF-1si) (right panels). Total F4/80-positive (upper panel) and Tie-2-positive (middle panel) cells as well as Tie-2-positive and Tie-2-negative F4/80-positive macrophage subpopulations were determined using flow cytometric analysis. *, Significantly different from Co d24 (p < 0.048).
Figure 5
Figure 5
muCSF-1 blockade reduces MMP-12 expression and increases expression of TIMPs in SK-N-AS and SK-N-DZ NB xenografts. Representative western blot images, together with the data for quantitative determination of protein expression in tumor lysates of MMP-2 and -12 (upper panels) and TIMP-2 and -3 (lower panels) for control mice on days 10 (Co d10) and 24 (Co d24) and in mice treated with Ringer's solution (Ringer), scrambled siRNA (scr si) or muCSF-1 siRNA (muCSF-1 si). *, Significantly different from Co d10 (p < 0.022 in MMP-2, p < 0.02 in MMP-12, p < 0.013 in TIMP-2, p < 0.005 in TIMP-3); †, significantly different from Co d24, Ringer and scr si (p < 0.015 in MMP-12, p < 0.007 in TIMP-2, p < 0.001 in TIMP-3).
Figure 6
Figure 6
Angiogenic activity in SK-N-AS and SK-N-DZ NB tumor xenografts is decreased by muCSF-1 blockade. (a) Representative immunocytochemical images of vWF-stained tumor tissue sections in control mice on day 24 (Co d24) and in mice treated with muCSF-1 siRNA (muCSF-1 si) (left panels) together with quantification of vWF-positive ECs (right panel). Arrowheads indicate vWF-positive cells. *, Significantly different from control on day 10 (Co d10; p < 0.001; †, significantly different from Co d24, Ringer and scr si, p < 0.001). Scale bar = 100 μm. (b) Quantitative RT-PCR measurements of mRNA of mouse VEGF-A, mouse VEGF-A receptor KDR and human VEGF-A in tumor lysates. *, Significantly different from control on day 10 (Co d10; p < 0.047 in mouse VEGF-A, p < 0.03 in KDR and p < 0.001 in human VEGF-A); †, significantly different from Co d24, Ringer and scr si (p < 0.036 in mouse VEGF-A, p < 0.007 in KDR and p < 0.006 in human VEGF-A).
Figure 7
Figure 7
Proposed model for the role of host and cancer cell-derived CSF-1-regulated tumor development in SK-N-AS and SK-N-DZ NB. (a) SK-N-AS tumor model. A subset of circulating monocytes transverse the basement membrane (BM) and endothelium (ENDO) and migrate to the tumor as tumor-associated macrophages (TAMs). TAM recruitment is promoted by host CSF-1 and VEGF-A derived from TAMs and stromal cells (fibroblasts) and (human) CSF-1 derived from tumor cells. TAMs then support tumor growth and invasion by secretion of growth factors and extracellular matrix modifying factors. Stromal cell-derived (mouse) CSF-1 does not activate human CSF-1R on cancer cells. (b) SK-N-DZ tumor model. A subset of circulating monocytes transverse the BM and ENDO and migrate to the tumor as TAMs. TAM recruitment is promoted by host CSF-1 and VEGF-A derived from TAMs and stromal cells (fibroblasts). TAMs then support tumor growth and invasion by secretion of growth factors and extracellular matrix modifying factors, highlighting the importance of host CSF-1 in this model. There is no human CSF-1 autocrine loop in SK-N-DZ tumor cells.

References

    1. Brodeur G, Maris J. Neuroblastoma. In: Pizzo P, Poplack DG, editors. Cytokine reference. 4th edn. Academic press; London: 2002. pp. 895–938.
    1. van Noesel MM, Versteeg R. Pediatric neuroblastomas: genetic and epigenetic ‘danse macabre.’. Gene. 2004;325:1–15. - PubMed
    1. Brodeur GM. Neuroblastoma: biological insights into a clinical enigma. Nat Rev Cancer. 2003;3:203–16. - PubMed
    1. Goldsmith KC, Hogarty MD. Targeting programmed cell death pathways with experimental therapeutics: opportunities in high-risk neuroblastoma. Cancer Lett. 2005;228:133–41. - PubMed
    1. Nilsson JA, Keller UB, Baudino TA, Yang C, Norton S, Old JA, Nilsson LM, Neale G, Kramer DL, Porter CW, Cleveland JL. Targeting ornithine decarboxylase in Myc-induced lymphomagenesis prevents tumor formation. Cancer Cell. 2005;7:433–44. - PubMed

Publication types

MeSH terms

Substances