. 2009 Aug 27:10:85.
doi: 10.1186/1471-2199-10-85.

YY1 is autoregulated through its own DNA-binding sites

Affiliations

YY1 is autoregulated through its own DNA-binding sites

Jeong Do Kim et al. BMC Mol Biol. .

Abstract

Background: The transcription factor Yin Yang 1 (YY1) is a ubiquitously expressed, multifunctional protein that controls a large number of genes and biological processes in vertebrates. As a general transcription factor, the proper levels of YY1 protein need to be maintained for the normal function of cells and organisms. However, the mechanism for the YY1 homeostasis is currently unknown.

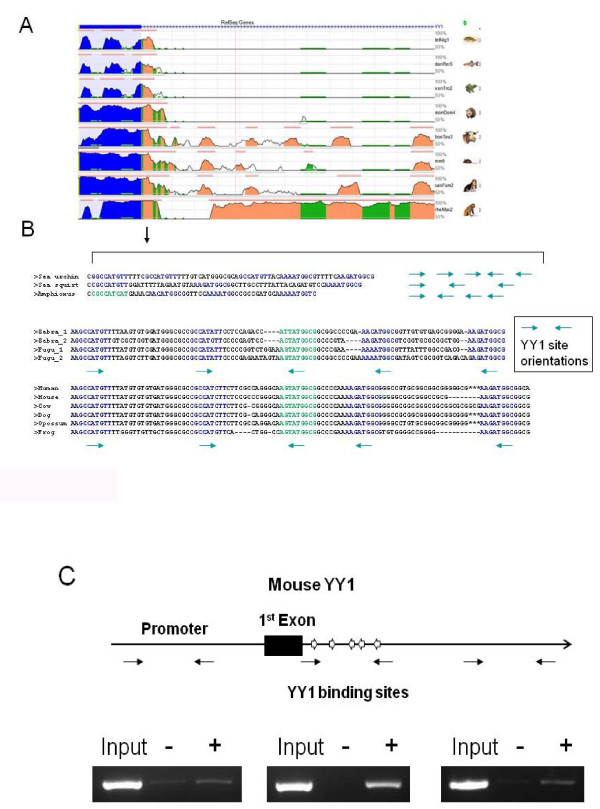
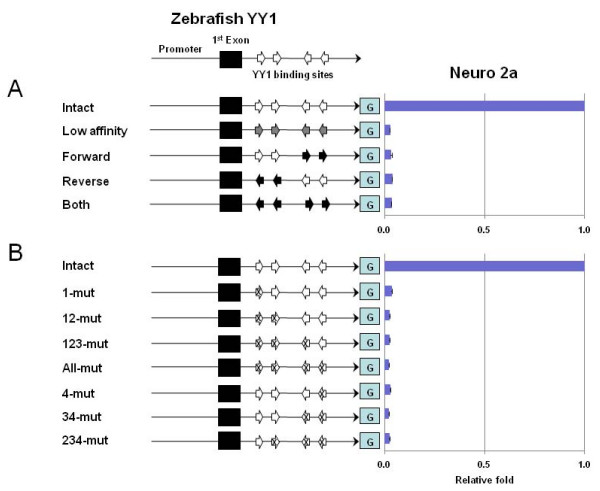
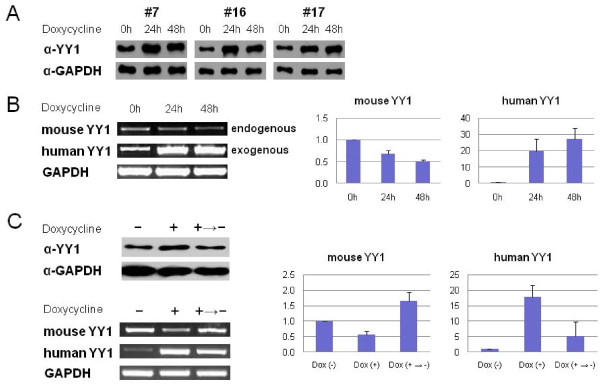
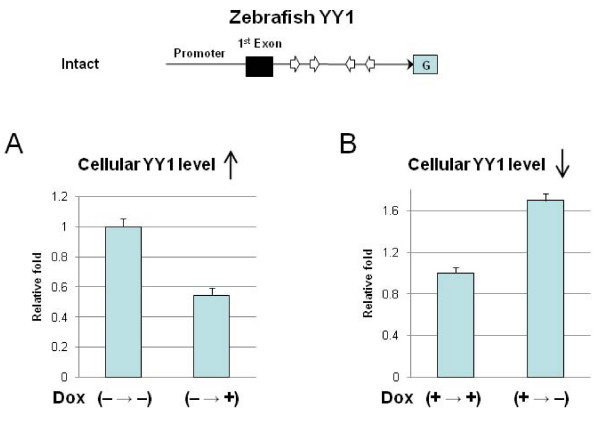
Results: The current study reports that the YY1 gene locus of all vertebrates contains a cluster of its own DNA-binding sites within the 1st intron. The intact structure of these DNA-binding sites is absolutely necessary for transcriptional activity of the YY1 promoter. In an inducible cell line system that over-expresses an exogenous YY1 gene, the overall increased levels of YY1 protein caused a reduction in transcription levels of the endogenous YY1 gene. Reversion to the normal levels of YY1 protein restored the transcriptional levels of the endogenous YY1 to normal levels. This homeostatic response was also mediated through its cluster of YY1 binding sites.

Conclusion: Taken together, the transcriptional level of YY1 is self-regulated through its internal DNA-binding sites. This study identifies YY1 as the first known autoregulating transcription factor in mammalian genomes.


Figures

Figure 1
Figure 1
Evolutionary conservation of the YY1 binding sites in the 1st intron of YY1. The ECR (Evolutionary Conserved Region) browser shows that the 1st exon and the beginning region of the 1st intron of YY1 are well conserved among eight species: tetraodon, zebrafish, frog, opossum, cow, mouse, dog, and rhesus macaque. Human YY1 was used as a reference sequence for this alignment. The height of the graph peaks indicate the level of nucleotide identity, while blue and salmon colors indicate exon and intron regions, respectively (A). The genomic sequences of the 1st intron of YY1 from 11 different species were also manually aligned: one each from purple sea urchin, sea squirt and amphioxus, two from each of two fish, one from frog, and five from mammals. The YY1 binding sequences marked in blue and green indicate the perfectly and imperfectly-matched YY1 binding sequences, respectively. The arrows on the right side of the sequences or under the YY1 binding sequences indicate the orientation of individual YY1 binding sites (B). The genomic region surrounding the five YY1 binding sites located within the 1st intron of mouse YY1. The YY1 binding sites are indicated by thick arrows with orientations, while the 1st exon by a closed rectangle. The thin arrows underneath the genomic layout indicate the position and direction of primer sets used for the PCR amplification of ChIP DNAs. The amplified PCR products of each region are shown as the following order: Input (lane 1), the ChIP DNA with rabbit normal serum (lane 2), and the ChIP DNA with YY1 antibody (lane 3) (C).
Figure 2
Figure 2
The cluster of YY1 binding sites as a transcriptional activator. The schematic diagram shows the promoter region of the zebrafish YY1 containing the 1st exon and 4 perfect-matched YY1 binding sites (arrows). This promoter region was subcloned into the IRES-β-Geo promoterless vector, and subsequently modified to change the binding affinity and orientation of individual YY1 binding sites (A). Open arrows indicate the intact YY1 binding sites, while the gray arrows indicate the YY1 binding sites with lower affinity to the YY1 protein. All the YY1 binding sites in the Low affinity construct were modified from (A/C)GCCATnTT to AACCATnTT. The orientation of the YY1 binding sites marked by closed arrows is reversed with respect to the endogenous binding sites. The Forward construct has all binding sites in the forward direction; the Reverse construct has all in a reverse direction; and the Both construct contains both pairs in a reverse direction. The binding potential of these sites was also completely abolished through changing from GCCATnTT to ATTATnTT (B). The numbers in the name of each construct indicate the position of mutated YY1 binding site. The promoter activity of each construct was analyzed more than three times, and the averaged value is shown along with S.D. (Standard Deviation). The averaged value for each construct was further compared with that of the Control construct. These promoter assays were performed using two different cell lines, Neuro2A and NIH3T3. Only the result set from the Neuro2A cell line is shown in graphs since the result set derived from NIH3T3 showed almost identical patterns.
Figure 3
Figure 3
Homeostatic responses of the YY1 locus against the fluctuating levels of YY1 protein. A Tet-On induction system over-expressing human YY1 was established to control the cellular levels of YY1 protein in the Neuro2A cell line. Three stable YY1 inducible clones (#7, #16 and #17) were analyzed to determine the overall levels of YY1 protein at 0, 24 and 48 hours after the treatment of 1 ug/ml Dox with western blot analyses using YY1 and GAPDH antibodies (A). RT-PCR and quantitative RT-PCR were performed using total RNAs isolated from the same cell set as used in the above. The primer sets for RT-PCR were designed to distinguish between endogenous mouse and exogenous human YY1 (B). The transcriptional response from the endogenous mouse YY1 was further analyzed using a scheme which allows a cycle of up and down regulation of the human YY1 through Dox administration and withdrawal, respectively (C). Western blot analysis showed the concurrent up and down regulated levels of YY1 protein. Following RT-PCR and qRT-PCR also confirmed this pattern in the exogenous human YY1. As predicted, the endogenous mouse YY1 showed an opposite pattern: the down and up-regulation in response to the increased and decreased overall levels of YY1 protein.
Figure 4
Figure 4
YY1 is autoregulated through its own binding sites. To demonstrate autoregulation through YY1's internal binding sites, we have analyzed the transcriptional activity of the zebrafish YY1 promoter with/without the YY1 binding sites at the two different cellular level of YY1 protein. These different conditions were set up using a Tet-On induction system over-expressing exogenous YY1. Before the transfection, the cell line was incubated in the absence (A) and presence (B) of the inducer, Dox. During transfection, Dox was added (A) and removed (B) to make the YY1 protein levels higher and lower, respectively, that the control cell line. Two constructs, Control and All mut, were individually transfected into the two different inducible cell lines, #7 and #16, along with the internal control luciferase vector (pGL3 control) in order to normalize β-gal activity.

Similar articles

Cited by

References

    1. Liu H, Shi Y. Ying Yang 1. In: Iuchi S, Kuldell N, editor. Zinc Finger Proteins: From Atomic Contact to Cellular Function. New York: Kluwer Academic/Plenum; 2005. pp. 182–194.
    1. Thomas MJ, Seto E. Unlocking the mechanisms of transcription factor YY1: are chromatin modifying enzymes the key? Gene. 1999;236:197–208. doi: 10.1016/S0378-1119(99)00261-9. - DOI - PubMed
    1. Gordon S, Akopyan G, Garban H, Bonavida B. Transcription factor YY1: structure, function, and therapeutic implications in cancer biology. Oncogene. 2006;25:1125–1142. doi: 10.1038/sj.onc.1209080. - DOI - PubMed
    1. He Y, Casaccia-Bonnefil P. The Yin and Yang of YY1 in the nervous system. J Neurochem. 2008;106:1493–1502. doi: 10.1111/j.1471-4159.2008.05486.x. - DOI - PMC - PubMed
    1. Schug J, Schuller W-P, Kappen C, Salbaum JM, Bucan M, Stoeckert CJ. Promoter features related to tissue specificity as measured by Shannon entropy. Genome Biol. 2005;6:R33. doi: 10.1186/gb-2005-6-4-r33. - DOI - PMC - PubMed

Publication types

Substances