. 2009 Oct 7;28(19):3015-26.
doi: 10.1038/emboj.2009.242. Epub 2009 Aug 27.

Modulation of intracellular ROS levels by TIGAR controls autophagy

Affiliations

Modulation of intracellular ROS levels by TIGAR controls autophagy

Karim Bensaad et al. EMBO J. .

Abstract

The p53-inducible TIGAR protein functions as a fructose-2,6-bisphosphatase, promoting the pentose phosphate pathway and helping to lower intracellular reactive oxygen species (ROS). ROS functions in the regulation of many cellular responses, including autophagy--a response to stress conditions such as nutrient starvation and metabolic stress. In this study, we show that TIGAR can modulate ROS in response to nutrient starvation or metabolic stress, and functions to inhibit autophagy. The ability of TIGAR to limit autophagy correlates strongly with the suppression of ROS, with no clear effects on the mTOR pathway, and is p53 independent. The induction of autophagy in response to loss of TIGAR can function to moderate apoptotic response by restraining ROS levels. These results reveal a complex interplay in the regulation of ROS, autophagy and apoptosis in response to TIGAR expression, and shows that proteins similar to TIGAR that regulate glycolysis can have a profound effect on the autophagic response through ROS regulation.


Conflict of interest statement

The authors declare that they have no conflict of interest.

Figures
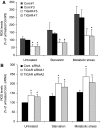
Figure 1
Figure 1
TIGAR regulates intracellular ROS levels in response to nutrient starvation or metabolic stress. (A) ROS levels in U2OS cells stably over-expressing Flag-tagged-TIGAR (clones TIGAR#5 and TIGAR#7) or control cells (clones Cont#1 and Cont#3) left untreated, after 6 h of nutrient starvation or 24 h of metabolic stress. ROS levels were measured by flow cytometry after DCF treatment. The results are expressed as the mean DCF fluorescence (and standard deviation), from three independent experiments. (B) Basal, nutrient starvation-induced (5 h) or metabolic stress-induced (18 h) ROS levels in U2OS cells in the presence of either scrambled, TIGAR siRNA1 or TIGAR siRNA2, measured by flow cytometry after DCF treatment. The results are expressed as the mean intensity of cell fluorescence (and standard deviation). * represents significant difference from control conditions (P<0.05).
Figure 2
Figure 2
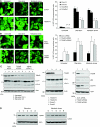
TIGAR expression modulates autophagy in response to nutrient starvation or metabolic stress. (A) (Left panel) Confocal microscopic images of the fluorescence in U2OS cells stably over-expressing Flag-tagged-TIGAR (clone TIGAR#7) or control cells (clone Cont#1) and infected with an adenovirus expressing GFP-LC3 for 16 h. Cells were then left untreated, exposed to nutrient starvation for 6 h or to metabolic stress for 24 h. (Right panel) Quantitation of the percentage of GFP-LC3–positive cells displaying GFP puncta from three independent experiments. The mean values with standard deviation are presented. (B) (Left panel) Confocal microscopic images of the fluorescence in U2OS cells stably expressing GFP-LC3 and transfected with scrambled or TIGAR siRNAs. After 48 h transfection, cells were then left untreated, exposed to nutrient starvation for 5 h or to metabolic stress for 18 h. (Right panel) Quantitation of the percentage of GFP-LC3–positive cells displaying GFP puncta from three independent experiments. The mean values with standard deviation are presented. (C) (Left panel) Western blot showing the expression levels of endogenous LC3-I, LC3-II and TIGAR in U2OS cells transfected with scrambled or TIGAR siRNAs, and 48 h later exposed to nutrient starvation for 0, 2.5 and 6 h. (Middle panel) Western blot showing the expression levels of endogenous LC3-I, LC3-II and TIGAR in U2OS stably over-expressing Flag-tagged-TIGAR (clones TIGAR#5 and TIGAR#7) or control cells (clones Cont#1 and Cont#3) and left untreated. (Right panel) Western blot showing the expression levels of p62, COX-IV and TIGAR in U2OS cells transfected with scrambled or TIGAR siRNAs and left untreated. Actin expression was examined as a loading control. (D) Western blot showing the expression levels of endogenous TIGAR in U2OS cells after exposure to nutrient starvation or metabolic stress for 0, 1, 3, 5 and 8 h; * represents significant difference from control conditions (P<0.05); # represents a lack of significant difference from control conditions (P>0.05).
Figure 3
Figure 3
TIGAR expression modulates autophagy independently of p53. (A) Quantitation of the percentage of GFP-LC3–positive cells displaying GFP puncta. U2OS cells stably expressing GFP-LC3 were transfected with scrambled or TIGAR siRNAs, and 48 h after transfection, cells were left untreated (t0) or treated with Bafilomycin A1 (100 nM) for 1 or 2 h (t1 and t2). The percentage of cells with GFP-LC3 puncta was calculated at the indicated time points. Data are shown as the mean and standard deviation from three independent experiments. (B) Quantitation of the percentage of GFP-LC3–positive cells displaying GFP puncta. U2OS cells stably expressing GFP-LC3 were cotransfected with scrambled or TIGAR siRNAs, and scrambled or p53 siRNA. After 48 h transfection, cells were left untreated or exposed for 5 h to nutrient starvation. The percentage of cells with GFP-LC3 puncta was calculated, and data are shown as the mean and standard deviation from three independent experiments. (C) Western blot showing the expression levels of endogenous p53 and TIGAR in U2OS cells cotransfected with scrambled or TIGAR siRNAs, and scrambled or p53 siRNA, and 48 h later exposed to nutrient starvation for 5 h. Actin expression was examined as a loading control. (D) Quantitation of the percentage of GFP-LC3–positive cells displaying GFP puncta. U2OS cells stably expressing GFP-LC3 were cotransfected with scrambled or TIGAR siRNAs, and scrambled or DRAM siRNA1/2. After 48 h transfection, cells were left untreated or exposed for 5 h to nutrient starvation. The percentage of cells with GFP-LC3 puncta was calculated, and data are shown as the mean and standard deviation from three independent experiments; * represents significant difference from starved control conditions (P<0.05); @ represents significant difference from untreated control conditions (P<0.05); # represents a lack of significant difference from control conditions (P>0.05).
Figure 4
Figure 4
Modulation of ROS by TIGAR correlates with the modulation of autophagy. (A) U2OS cells were left untreated, exposed to nutrient starvation for 6 h or to metabolic stress for 24 h, with or without treatment with AO1 (NAC (2 mM) and L-ascorbic acid (2 mM)) for 24 h. The percentage of cells with GFP-LC3 puncta was calculated, and data are shown as the mean and standard deviation from three independent experiments. (B) (Left panel) ROS levels in U2OS cells left untreated or treated with 0.5 or 1 mM of H2O2 for 24 h. ROS levels were measured by flow cytometry after DCF treatment. The results are expressed as the mean DCF fluorescence (and standard deviation) from three independent experiments. (Right panel) Quantitation of the percentage of GFP-LC3 puncta positive cells for cells treated as described above. Data are shown as the mean and standard deviation from three independent experiments. (C) Quantitation of the percentage of GFP-LC3 puncta positive cells. U2OS cells stably expressing GFP-LC3 were transfected with vector pCHER1A expressing the mCherry gene as control, or expression plasmids for Flag-tagged-TIGAR or HA-tagged-FBPase-2. After 48 h transfection, cells were left untreated, exposed to nutrient starvation for 6 h or to metabolic stress for 24 h, with or without treatment with AO1 (NAC (2 mM) and L-ascorbic acid (2 mM)) for 24 h. The percentage of cells with GFP-LC3 puncta was calculated, and data are shown as the mean and standard deviation from three independent experiments. (D) Quantitation of the percentage of GFP-LC3 puncta positive cells. Cells were left untreated, exposed to nutrient starvation for 6 h with or without treatment with AO1 (NAC (2 mM) and L-ascorbic acid (2 mM)), AO2 (glutathione ethyl ester (4 mM)) or AO3 (ethyl pyruvate (4 mM)) for 24 h. U2OS cells stably expressing GFP-LC3 were transfected with vector pCHER1A expressing the mCherry gene as control, or expression plasmid for Flag-tagged-TIGAR. After 48 h transfection, cells were treated. The percentage of cells with GFP-LC3 puncta was calculated, and data are shown as the mean and standard deviation from three independent experiments. (E) (Left panel) Quantitation of the percentage of GFP-LC3 puncta positive cells. Cells were left untreated, exposed to nutrient starvation for 5 h or to metabolic stress for 18 h, with or without treatment with AO1 (NAC (2 mM) and L-ascorbic acid (2 mM)) for 24 h. U2OS cells stably over-expressing GFP-LC3 in the presence of either scrambled, TIGAR siRNA1 or TIGAR siRNA2. (Right panel) Basal or nutrient starvation-induced (5 h) ROS levels in U2OS cells in the presence of either scrambled, TIGAR siRNA1 or TIGAR siRNA2 with or without treatment with AO1 (NAC (2 mM) and L-ascorbic acid (2 mM)) for 24 h, measured by flow cytometry after DCF treatment. The results are expressed as the mean intensity of cell fluorescence (and standard deviation). * represents significant difference from control conditions (P<0.05); # represents a lack of significant difference from control conditions (P>0.05).
Figure 5
Figure 5
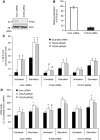
TIGAR modulates ROS levels upstream of the autophagic response. (A) Western blot showing knockdown of ATG5 protein expression by ATG5 siRNA. (B) RT–PCR showing knockdown of ATG10 mRNA expression by ATG10 siRNA. (C) Quantitation of the percentage of GFP-LC3 puncta positive cells. U2OS cells stably over-expressing GFP-LC3 in the presence of either scrambled, TIGAR siRNA1 or TIGAR siRNA2, and either scrambled, ATG5 siRNA or ATG10 siRNA. After 48 h, cells were left untreated or exposed to nutrient starvation for 5 h. (D) ROS levels in U2OS cells in the presence of either scrambled, TIGAR siRNA1 or TIGAR siRNA2, and scrambled, ATG5 siRNA or ATG10 siRNA, measured by flow cytometry after DCF treatment. After 48 h, cells were left untreated or exposed to nutrient starvation for 5 h. The results are expressed as the mean intensity of cell fluorescence (and standard deviation). * represents significant difference from control conditions (P<0.05); # represents a lack of significant difference from control conditions (P>0.05).
Figure 6
Figure 6
TIGAR modulation of autophagy influences apoptosis. (A) Quantitation of the percentage of GFP-LC3 puncta positive cells. U2OS cells stably over-expressing Flag-tagged-TIGAR (clones TIGAR#5 and TIGAR#7) or control cells (clones Cont#1 and Cont#3) were left untreated or exposed to nutrient starvation for 6 h, with or without treatment with Z-VAD-FMK for 24 h. The percentage of cells with GFP-LC3 puncta was calculated, and data are shown as the mean and standard deviation of the mean from three independent experiments. (B) Apoptosis in U2OS cells stably over-expressing Flag-tagged-TIGAR (clones TIGAR#5 and TIGAR#7) or control cells (clones Cont#1 and Cont#3), as measured by cells with a sub-G1 DNA content. Cells were transfected with either scrambled, TIGAR siRNA1 or TIGAR siRNA2. Cells were left untreated, exposed to nutrient starvation for 6 h or to metabolic stress for 24 h. (C) Apoptosis in U2OS cells cotransfected with scrambled or TIGAR siRNAs, and scrambled, ATG5 siRNA or ATG10 siRNA, as measured by cells with a sub-G1 DNA content. After 48 h, cells were left untreated, exposed to nutrient starvation for 6 h or to metabolic stress for 24 h. Data are shown as the mean and standard deviation from three independent experiments. In each case, the increase in apoptosis after knockdown of ATG5 or ATG10, compared with the matched control, was statistically significant; * represents significant difference from control conditions (P<0.05); # represents a lack of significant difference from control conditions (P>0.05).

References

    1. Averous J, Proud CG (2006) When translation meets transformation: the mTOR story. Oncogene 25: 6423–6435 - PubMed
    1. Azad MB, Chen Y, Gibson SB (2009) Regulation of autophagy by reactive oxygen species (ROS): implications for cancer progression and treatment. Antioxid Redox Signal 11: 777–790 - PubMed
    1. Balaban RS, Nemoto S, Finkel T (2005) Mitochondria, oxidants, and aging. Cell 120: 483–495 - PubMed
    1. Bampton ET, Goemans CG, Niranjan D, Mizushima N, Tolkovsky AM (2005) The dynamics of autophagy visualized in live cells: from autophagosome formation to fusion with endo/lysosomes. Autophagy 1: 23–36 - PubMed
    1. Bensaad K, Tsuruta A, Selak MA, Vidal MN, Nakano K, Bartrons R, Gottlieb E, Vousden KH (2006) TIGAR, a p53-inducible regulator of glycolysis and apoptosis. Cell 126: 107–120 - PubMed

Publication types

MeSH terms

Substances