. 2009 Aug;5(8):e1000626.
doi: 10.1371/journal.pgen.1000626. Epub 2009 Aug 28.

The fission yeast homeodomain protein Yox1p binds to MBF and confines MBF-dependent cell-cycle transcription to G1-S via negative feedback

Affiliations

The fission yeast homeodomain protein Yox1p binds to MBF and confines MBF-dependent cell-cycle transcription to G1-S via negative feedback

Sofia Aligianni et al. PLoS Genet. 2009 Aug.

Abstract

The regulation of the G1- to S-phase transition is critical for cell-cycle progression. This transition is driven by a transient transcriptional wave regulated by transcription factor complexes termed MBF/SBF in yeast and E2F-DP in mammals. Here we apply genomic, genetic, and biochemical approaches to show that the Yox1p homeodomain protein of fission yeast plays a critical role in confining MBF-dependent transcription to the G1/S transition of the cell cycle. The yox1 gene is an MBF target, and Yox1p accumulates and preferentially binds to MBF-regulated promoters, via the MBF components Res2p and Nrm1p, when they are transcriptionally repressed during the cell cycle. Deletion of yox1 results in constitutively high transcription of MBF target genes and loss of their cell cycle-regulated expression, similar to deletion of nrm1. Genome-wide location analyses of Yox1p and the MBF component Cdc10p reveal dozens of genes whose promoters are bound by both factors, including their own genes and histone genes. In addition, Cdc10p shows promiscuous binding to other sites, most notably close to replication origins. This study establishes Yox1p as a new regulatory MBF component in fission yeast, which is transcriptionally induced by MBF and in turn inhibits MBF-dependent transcription. Yox1p may function together with Nrm1p to confine MBF-dependent transcription to the G1/S transition of the cell cycle via negative feedback. Compared to the orthologous budding yeast Yox1p, which indirectly functions in a negative feedback loop for cell-cycle transcription, similarities but also notable differences in the wiring of the regulatory circuits are evident.


Conflict of interest statement

The authors have declared that no competing interests exist.

Figures

Figure 1
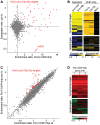
Figure 1. Yox1p is an MBF target and binds to MBF target genes.
(A) yox1 is periodically transcribed in the same cluster as MBF target genes. Two cell-cycle timecourse experiments of cells synchronized by cdc25 block-release (left) or centrifugal elutriation (right) showing the expression profiles of 24 putative Cdc10p-regulated genes (data from [14]). The yox1 expression profiles are shown in red. (B) Scatter plot showing gene expression ratios relative to wild-type in cdc10-C4 mutant cells (which shows increased expression of MBF target genes ; mean data from four repeats [14]) versus the enrichment ratios upstream of genes in Yox1p ChIP-chip experiments (mean data from three repeats). The putative Cdc10p-regulated genes shown in (A) are highlighted in red, and the cdc10 and yox1 genes are indicated with arrows. (C) Scatter plot as in (B) but showing gene expression ratios relative to wild-type in cdc10-C4 mutant cells versus the enrichment ratios upstream of genes in Cdc10p ChIP-chip experiments (mean data from three repeats). (D) The cell cycle-regulated gene cdc22 shows a particularly strong enrichment of both Cdc10p (blue) and Yox1p (red) upstream of its open reading frame. Example data from one repeat each are shown. Transcription of the four genes on chromosome 1 is from left to right (forward strand), and chromosome coordinates are indicated in kb.
Figure 2
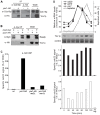
Figure 2. Yox1p binds via MBF to transcriptionally repressed MBF promoters.
(A) Western blot analysis of extracts from strains carrying untagged or HA tagged Yox1p. Immune precipitates (anti-Cdc10p and anti-HA) and whole cell extract (WCE) were probed with anti- Cdc10p or anti-HA antibodies to detect Cdc10p and Yox1p, respectively. (B) Western blot analysis of extracts from strains carrying myc tagged Res2p, HA tagged Yox1p, or both. Anti-myc immune precipitates and whole cell extract (WCE) were probed with anti-myc or anti-HA antibodies to detect Res2p or Yox1p, respectively. (C) Bar graphs of PCR-amplified cdc22 promoter fragments obtained from anti-HA ChIPs and quantified by qPCR as percentage of WCE signal. Signals are shown for cells without tagged Yox1p (wt) and for cells with HA tagged Yox1p in wild-type, res2Δ and nrm1Δ backgrounds. (D) Small wild-type cells were isolated by centrifugal elutriation and allowed to progress synchronously through the cell cycle with time points indicated at the bottom. Top graph: cdc22, cdc18, and yox1 mRNA levels (100% is maximum) determined by RT qPCR, along with septation index (S-phase coincides with septation peak). Below top graph: Yox1p-HA protein levels are detected by anti-HA antibodies at the same time points, with amido black staining of the same membrane shown as loading control. Middle and bottom bar graphs: PCR-amplified cdc22 and cdc18 promoter fragments, respectively, generated from Yox1p-HA ChIPs and quantified by qPCR as percentage of WCE signal. Signals detected in an immunoprecipitation from an unsynchronised culture without tagged genes provides as a negative control (no tag).
Figure 3
Figure 3. Yox1p inhibits transcription of target genes.
(A) Yox1p and Cdc10p target genes tend to be more highly expressed in yox1Δ cells. Scatter plot showing gene expression relative to wild-type in yox1Δ mutant (mean data from three repeats on spotted arrays) versus the enrichment ratios upstream of genes in Yox1p ChIP-chip experiments (mean data from three repeats). The cell cycle-regulated target genes common to Yox1p and Cdc10p are highlighted in red, and mfm2 is indicated with an arrow. (B) Cdc10p but not Ace2p target genes are highly expressed in yox1Δ cells. Hierarchical cluster analysis with rows representing Yox1p and Cdc10p target genes (top) or putative Ace2p-regulated genes (bottom; [14]). The two columns on the left represent expression profiling data of yox1Δ versus wild-type cells (average data of three repeats on spotted arrays and of two repeats on Affymetrix chips, respectively), with relative mRNA levels color-coded as indicated at the bottom. The three columns on the right represent ChIP-chip data (average data of two Cdc10p, five Yox1p, and two mock IPs, respectively), with the strength of enrichment color-coded as indicated at the bottom. Grey indicates missing data. (C) Yox1p and Cdc10p target genes tend to have higher Pol II occupancy in yox1Δ cells. Scatter plot showing the relative Pol II occupancy across genes in yox1Δ cells versus the relative Pol II occupancy across genes in wild-type cells (mean data from three repeats each). The target genes common to Yox1p and Cdc10p are highlighted in red as in (A). (D) Cdc10p but not Ace2p target genes show higher Pol II occupancy in yox1Δ relative to wild-type cells. Hierarchical cluster analysis with rows representing Yox1p/Cdc10p-regulated genes (top) or putative Ace2p-regulated genes (bottom; [14]). The three columns represent independent repeats of ChIP-chip experiments, with enrichment ratios in yox1Δ relative to wild-type cells color-coded as indicated at the bottom.
Figure 4
Figure 4. Cell-cycle defects in yox1Δ cells.
(A) Yox1p/Cdc10p target genes are not cell cycle-regulated in yox1Δ cells. Top graph: Two cell-cycle timecourse experiments of wild-type cells (left; [14]) and yox1Δ cells (right) synchronized by centrifugal elutriation, showing the expression profiles of cell cycle-regulated target genes common to Yox1p and Cdc10p (red) and putative Ace2p target genes (green; [14]). The histone genes hta1 and htb1 are highlighted in blue. The expression profiles were measured using spotted arrays and normalized such that the median expression ratios are equal to 1 for each timecourse. Bottom graph: As top graph but showing the mean absolute signal intensities, normalized to 50th percentile of measurements from each array, for Ace2p (green) and for Yox1p/Cdc10p (red) targets. Note that the timepoints of wild-type and yox1Δ experiments are not normalized relative to the cell cycle, and absolute times cannot be directly compared. (B) Normal growth of yox1Δ cells. 10-fold serial dilutions of wild-type (top) and yox1Δ (bottom) cells spotted on rich media. (C) Elongated phenotype in yox1Δ cells. Wild-type (top) and yox1Δ (bottom) cells were stained with calcofluor to highlight cell wall and division septa.
Figure 5
Figure 5. Common and specific Cdc10p and Yox1p targets.
(A) Cdc10p and Yox1p target genes predominantly peak in expression around G1/S. The top-500 cell cycle–regulated genes were ordered in columns by their peak expression times with 0% and 100% of cell-cycle time set around the G2/M transition. Relative peak times are indicated on top along with approximate cell-cycle phases. The rows (from top to bottom) correspond to two independent repeats of Cdc10p ChIP-chip, five independent repeats of Yox1p ChIP-chip, and two independent repeats of mock IPs. The orange shading reflects the strength of relative enrichment as indicated in legend (top left). (B) Comparison of Cdc10p and Yox1p targets. Scatter plot showing the enrichment ratios upstream of genes in Cdc10p ChIP-chip experiments (mean data from three repeats) versus the enrichment ratios upstream of genes in Yox1p ChIP-chip experiments (mean data from three repeats). The target genes common to Yox1p and Cdc10p are highlighted in red, and the genes flanking replication origins are highlighted in green, many of which are specifically enriched in Cdc10p ChIP-chip. (C) The divergently transcribed histone H3 and H4 genes (hht1 and hhf1, respectively) show enrichment of Yox1p (red), but not of Cdc10p (blue), in their shared promoter region. Example data from one repeat each are shown. Transcription of the three upper genes is from left to right (forward strand), while hhf1 is transcribed from right to left (reverse strand). Chromosome 1 coordinates are indicated in kb. (D) Cdc10p, but not Yox1p, frequently binds close to replication origins. Hierarchical cluster analysis with rows representing 445 genes flanking origins of replication and columns representing Cdc10p ChIP-chip (left, average of all experiments) and Yox1p ChIP-chip (right, average of all experiments). The strength of relative enrichment is indicated by orange shading as in (A). (E) The intergenic region between the genes SPAC27F1.05c and SPAC27F1.10 contains an origin of replication and shows enrichment of Cdc10p (blue), but not of Yox1p (red). Neither of these genes is cell cycle–regulated. Example data from one repeat each are shown. Transcription of the three genes is from right to left (reverse strand). Chromosome 1 coordinates are indicated in kb.
Figure 6
Figure 6. Yox1p-based negative feedback loops in fission and budding yeast.
Positive and negative regulation is indicated by arrows and bars, respectively. See main text for detailed comparison of regulatory circuits.

Similar articles

Cited by

References

    1. Bähler J. Cell-cycle control of gene expression in budding and fission yeast. Annu Rev Genet. 2005;39:69–94. - PubMed
    1. Breeden LL. Periodic transcription: a cycle within a cycle. Curr Biol. 2003;13:R31–R38. - PubMed
    1. Wittenberg C, Reed SI. Cell cycle-dependent transcription in yeast: promoters, transcription factors, and transcriptomes. Oncogene. 2005;24:2746–2755. - PubMed
    1. Nevins JR. The Rb/E2F pathway and cancer. Hum Mol Genet. 2001;10:699–703. - PubMed
    1. Sherr CJ, McCormick F. The RB and p53 pathways in cancer. Cancer Cell. 2002;2:103–112. - PubMed

Publication types

MeSH terms