. 2009 Aug;5(8):e1000565.
doi: 10.1371/journal.ppat.1000565. Epub 2009 Aug 28.

Trypanosoma brucei PUF9 regulates mRNAs for proteins involved in replicative processes over the cell cycle

Affiliations

Trypanosoma brucei PUF9 regulates mRNAs for proteins involved in replicative processes over the cell cycle

Stuart K Archer et al. PLoS Pathog. 2009 Aug.

Abstract

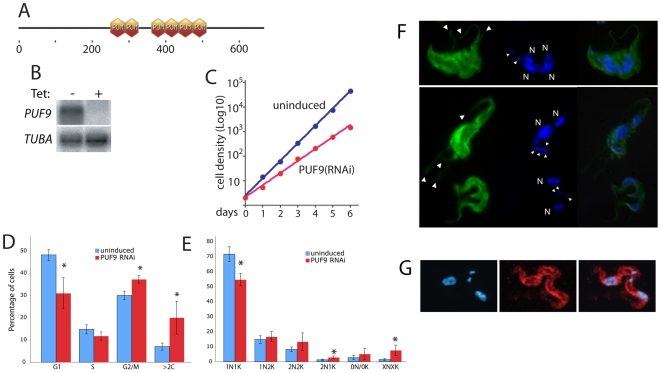
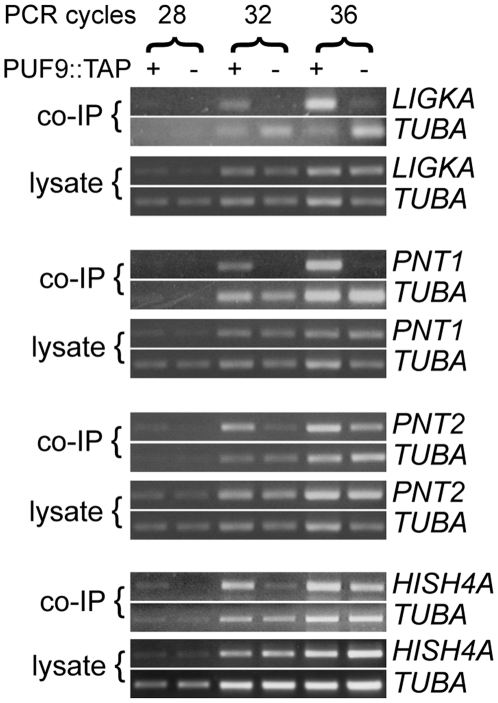
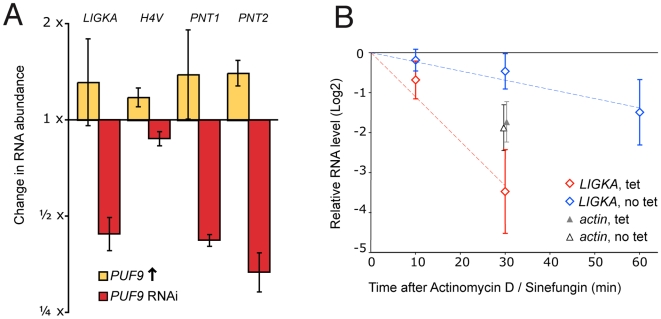
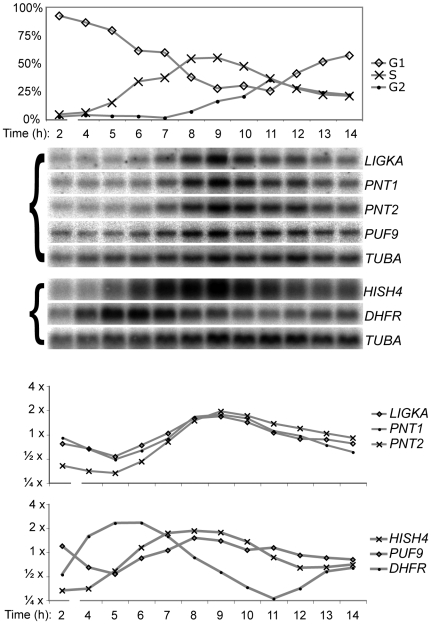
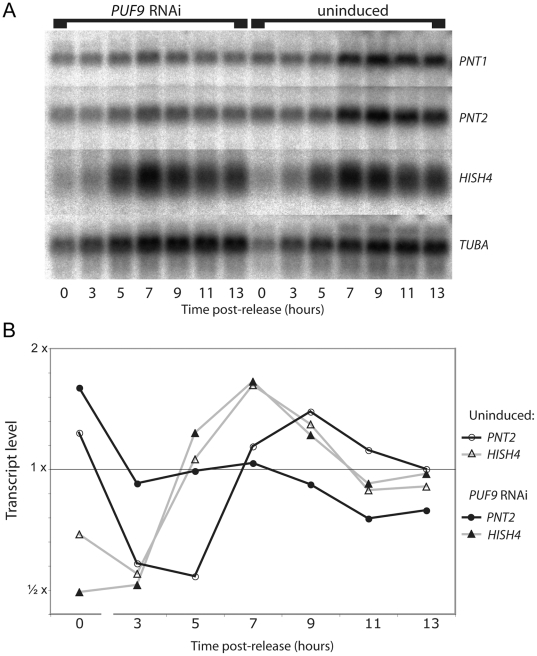
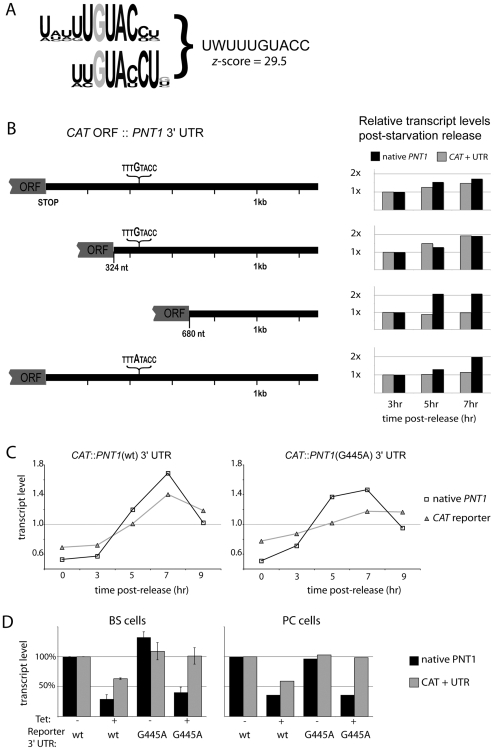
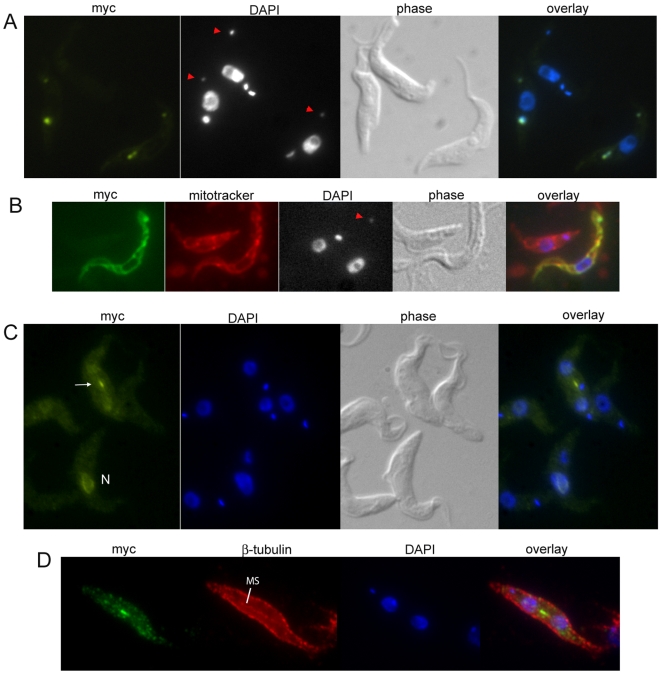
Many genes that are required at specific points in the cell cycle exhibit cell cycle-dependent expression. In the early-diverging model eukaryote and important human pathogen Trypanosoma brucei, regulation of gene expression in the cell cycle and other processes is almost entirely post-transcriptional. Here, we show that the T. brucei RNA-binding protein PUF9 stabilizes certain transcripts during S-phase. Target transcripts of PUF9--LIGKA, PNT1 and PNT2--were identified by affinity purification with TAP-tagged PUF9. RNAi against PUF9 caused an accumulation of cells in G2/M phase and unexpectedly destabilized the PUF9 target mRNAs, despite the fact that most known Puf-domain proteins promote degradation of their target mRNAs. The levels of the PUF9-regulated transcripts were cell cycle dependent, peaking in mid- to late- S-phase, and this effect was abolished when PUF9 was targeted by RNAi. The sequence UUGUACC was over-represented in the 3' UTRs of PUF9 targets; a point mutation in this motif abolished PUF9-dependent stabilization of a reporter transcript carrying the PNT1 3' UTR. LIGKA is involved in replication of the kinetoplast, and here we show that PNT1 is also kinetoplast-associated and its over-expression causes kinetoplast-related defects, while PNT2 is localized to the nucleus in G1 phase and redistributes to the mitotic spindle during mitosis. PUF9 targets may constitute a post-transcriptional regulon, encoding proteins involved in temporally coordinated replicative processes in early G2 phase.


Conflict of interest statement

The authors have declared that no competing interests exist.

Figures

Figure 1
Figure 1. PUF9 structure and RNAi phenotype.
A: Predicted domain structure of PUF9. Output from ExPASY showing six predicted Puf domains in the central region of the protein. B: Northern blot of RNA from BS cells, showing tet-inducible RNAi against the native ∼6 kb PUF9 transcript, normalized using the TUBA transcript. C: Cell densities of BS cultures were monitored with or without PUF9 RNAi. Cells were counted and diluted to 5×10⁴/ml every 24 hours. A cumulative curve is shown. Calculated generation times are indicated. D, E: Cells were scored for DNA content using flow cytometry (D), and for nuclear/kinetoplast division status by DAPI-staining and fluorescence microscopy (E) in PUF9 RNAi BS cells. RNAi was induced with tetracycline for 24 hours. At least 200 cells from each of four independent experiments were counted (microscopy). Cells lacking either the kinetoplast or nucleus were scored as 0N/0K while cells with >2 kinetoplasts or nuclei were scored as XNXK. The 95% confidence intervals are shown. (*) indicates significant difference from untreated controls by Student's T-test (p<0.05). F: Immunofluorescence microscopy on PUF9 RNAi BS cells. Cells were fixed and stained for β-tubulin with the KMX-1 antibody (a gift from Keith Gull) and for DNA with DAPI. Cells at top and middle are large (magnification for all panels is the same) and possess multiple flagella (large arrowheads), kinetoplasts (small arrowheads) and nuclei (N). At the bottom are two normal cells. G: C-terminally TAP-tagged PUF9 protein was localized to the cytoplasm by immunofluorescence using antibody against protein A (red). Nuclei and kinetoplasts were stained using DAPI (blue).
Figure 2
Figure 2. Verification of candidate PUF9 target transcripts.
RNPs were isolated by TAP purification from lysates of BS cells expressing the PUF9::TAP fusion protein (+) or the TAP tag alone (−). RNA was purified from the affinity-purified product (co-IP) and the flow-through fractions (FT) and used as templates for reverse transcription with a cocktail of gene-specific primers. The cDNA was used as template in PCR reactions to detect the indicated genes, and TUBA was used as an internal control for template concentration. Samples were collected at 28, 32 and 36 cycles, and analysed by agarose gel electrophoresis with ethidium bromide staining. No bands were detected when reverse transcriptase was omitted (not shown).
Figure 3
Figure 3. Effects of PUF9 on abundance and stability of target mRNAs.
A: Relative expression of PUF9 target mRNAs with alterations in PUF9 expression. PUF9 over-expressing or PUF9 RNAi BS cells were uninduced or induced with tet for 24 hours prior to RNA isolation and Northern blotting. The blot was probed for PUF9 and PUF9 target genes, and transcript abundance was determined by densiometric quantification. All bands were normalized against TUBA and then normalized against their abundance in the uninduced controls. Mean and standard error (p = 0.05) from three biological replicates are shown. B: Quantification of LIGKA mRNA after inhibition of RNA synthesis and processing. PUF9 RNAi or uninduced BS cells were treated at time t = −5 min with sinefungin and at time t = 0 with actinomycin D to inhibit mRNA processing and transcription, respectively. RNA was isolated at the indicated times and the LIGKA transcript was quantified by Northern blot and densiometric scanning on a phosphorimager. Band intensity was normalized against background and the stable SRP RNA was used as a loading control. Values were expressed relative to the intensity at t = 0 which was fixed at 1. Five biological replicates per condition were performed and used to generate a line of best fit on the log-transformed values. Three of these were also probed for the actin transcript as a control (normalized values at t = 30 shown as triangles). Error bars represent standard error of the mean (p = 0.05). Bands from the t = 60 time point were excluded as they were too faint to accurately quantify, except for the LIGKA transcript in the uninduced cells.
Figure 4
Figure 4. Cell-cycle-coupled regulation of PUF9 target transcripts and the PUF9 transcript itself.
Cells were synchronized in G1 phase by starvation for 2 days and released by dilution in fresh media. Samples were taken every hour for flow cytometric analysis of cell cycle phase (top) and also for RNA isolation and Northern blotting. All data are from a single representative experiment. Top: The percentage of cells in each phase of the cell cycle, calculated from flow cytometry histograms using the Watson algorithm. Center: Duplicate Northern blots (indicated with a left bracket) from the synchronized cells were probed for the three PUF9 targets and PUF9, as well as DHFR and the histone HISH4 as controls for synchronization and TUBA was used as a loading control. Bottom: Quantification of transcript abundance by densiometric scanning of the Northern blot, normalizing with respect to TUBA mRNA.
Figure 5
Figure 5. Effect of PUF9 RNAi on oscillation of its target transcripts in the cell cycle.
A: PC cells were induced to express a hairpin transcript to target PUF9 for RNAi during starvation-mediated G1 synchronization. After release by dilution in fresh media, samples were taken every two hours for flow cytometry to check for synchronization (not shown) and for isolation of RNA for Northern blotting. The Northern blot was probed for the PUF9 target PNT2, as well as TUBA to normalize for loading and HISH4 as a control for synchronization efficiency. B: Normalized quantification of the data shown in A. For all transcripts, the average intensity throughout the assay for that condition was set to 1.
Figure 6
Figure 6. Identification of regulatory elements in PUF9 target mRNAs.
A: The over-represented motif identified by Trawler. B: Derivatives of the PNT1 3′ UTR were fused to the CAT reporter ORF and tested for cell cycle-coupled transcript regulation. Quantification of Northern blots of synchronized cell cultures are shown. At least one replicate experiment was performed for each reporter shown, yielding similar results. Transcripts were normalized against TUBA and then against their own values at 3 hours post-release. C: Quantification of CAT reporter transcript abundance, fused to the PNT1 3′ UTR or the derived G445A point mutation, during progression through one cell cycle. Transcripts were normalized against TUBA and then against their own values at 3 hours post-release. D: Dependence of reporter transcript stability on PUF9 expression. The reporters described above (wt or G445A) were transformed into PC cells containing the PUF9 hairpin construct and RNAi against PUF9 was induced for 16 hours. RNAi was confirmed by Northern blot and probing for the native PNT1 transcript, which is dependent on PUF9 expression. Reporter transcript abundance was revealed by probing for the CAT ORF and normalizing against SRP. All transcripts were then normalized against their own abundance in the wt UTR/uninduced condition. Error bars represent 95% confidence intervals.
Figure 7
Figure 7. Localization of myc-tagged PNT1 and PNT2 protein.
PNT1::myc (A and B) and PNT2::myc (C and D) over-expressing PC cells, induced with tet for 16–24 hours, were fixed and stained with anti-myc antibody (A-C: sc-40, D: sc-789, Santa Cruz Biotechnology) and DAPI (shown in white in A and B to visualize faint ancillary kinetoplasts). A: PNT1::myc over-expressing cells exhibiting ancillary kinetoplasts (red arrowheads). Two of the three show PNT1 staining in both normal kinetoplasts (one as a doublet) and kinetoplast fragments. B: PNT1::myc/Mitotracker doubly stained cells. The bottom cell lacks a complete kinetoplast, retaining only a kinetoplast fragment near the posterior extremity (red arrowhead). C: A 1N1K cell showing nuclear PNT2 localization (N) and a 2N2K cell showing PNT2 localization to the spindle midzone (arrow). D: Co-staining of PNT2::myc with the KMX1 anti-tubulin antibody, using an alternative fixation protocol to visualize mitotic spindles (see Materials and Methods).

References

    1. Johnson LF, Fuhrman CL, Wiedemann LM. Regulation of dihydrofolate reductase gene expression in mouse fibroblasts during the transition from the resting to growing state. J Cell Physiol. 1978;97:397–306. - PubMed
    1. Stein G, Park W, Thrall C, Mans R, Stein J. Regulation of cell cycle stage-specific transcription of histone genes from chromatin by non-histone chromosomal proteins. Nature. 1975;257:764–767. - PubMed
    1. Noe V, Ciudad CJ, Chasin LA. Effect of differential polyadenylation and cell growth phase on dihydrofolate reductase mRNA stability. J Biol Chem. 1999;274:27807–27814. - PubMed
    1. Leys EJ, Crouse GF, Kellems RE. Dihydrofolate reductase gene expression in cultured mouse cells is regulated by transcript stabilization in the nucleus. J Cell Biol. 1984;99:180–187. - PMC - PubMed
    1. Harris ME, Bohni R, Schneiderman MH, Ramamurthy L, Schumperli D, et al. Regulation of histone mRNA in the unperturbed cell cycle: evidence suggesting control at two posttranscriptional steps. Mol Cell Biol. 1991;11:2416–2424. - PMC - PubMed

Publication types