

Review
doi: 10.1146/annurev.genom.9.081307.164242.
Genotype imputation
Affiliations
- PMID: 19715440
- PMCID: PMC2925172
- DOI: 10.1146/annurev.genom.9.081307.164242
Item in Clipboard
Review
Genotype imputation
Annu Rev Genomics Hum Genet.
2009.
Abstract
Genotype imputation is now an essential tool in the analysis of genome-wide association scans. This technique allows geneticists to accurately evaluate the evidence for association at genetic markers that are not directly genotyped. Genotype imputation is particularly useful for combining results across studies that rely on different genotyping platforms but also increases the power of individual scans. Here, we review the history and theoretical underpinnings of the technique. To illustrate performance of the approach, we summarize results from several gene mapping studies. Finally, we preview the role of genotype imputation in an era when whole genome resequencing is becoming increasingly common.
Figures

Panel A illustrates the observed data which consists of genotypes at a series of genetic markers. In this case, a subset of markers have been typed in all individuals (and are marked in red), whereas the remaining markers have been typed in only a few individuals (and appear in black in individuals in the top two generations of the pedigree). Panel B illustrates the process of inferring information on “identity-by-descent” by examining markers for which genotypes are available in all individuals. Each segment of identity by descent that appears in more than one individual is assigned a unique color. For example, a segment marked in purple is shared between the first individual in the grand-parental generation at the top of the pedigree, the first individual in the parental generation, and individuals 3 and 4 in the offspring generation at the bottom of the pedigree. In Panel C, observed genotypes and identity-by-descent information have been combined to fill in a series of genotypes that were originally missing in the offspring generation.
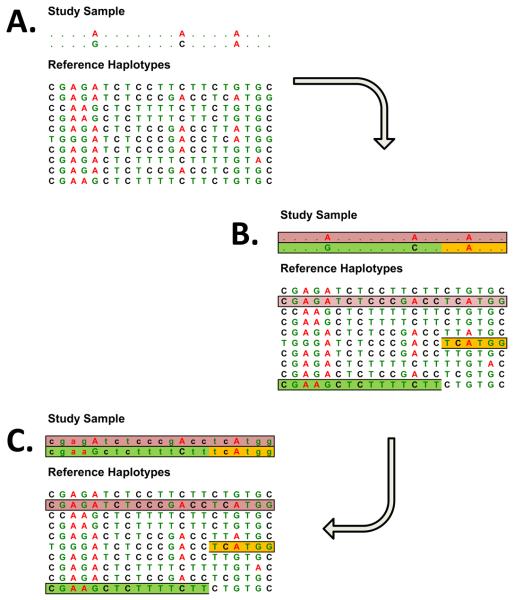
Panel A illustrates the observed data which consists of genotypes at a modest number of genetic markers in each sample being studied and of detailed information on genotypes (or haplotypes) for a reference sample. Panel B illustrates the process of identifying regions of chromosome shared between a study sample and individuals in the reference panel. When a typical sample of European ancestry is compared to haplotypes in the HapMap reference panel, stretches of >100kb in length are typically identified. In Panel C, observed genotypes and haplotype sharing information have been combined to fill in a series of unobserved genotypes in the study sample.

The figure illustrates evidence for association between genetic variants near LDLR and LDL-cholesterol levels using data from the SardiNIA (94) and Diabetes Genetics Initiative (DGI, 90) studies reported in Willer et al (111). Evidence for association at each SNP, measured as −log10 P-value, is represented along the y-axis. The placement of each SNP along the X axis corresponds to assigned chromosomal location in the current genome build. Results for directly genotype SNPs are colored in red, imputed SNPs are colored in blue. Note that rs6511720, the SNP showing strongest association in the region, is not well tagged by any of the variants on the Affymetrix genotyping arrays use in the SardiNIA and DGI studies. Evidence for association at the SNP increases to p < 10−25 after follow-up in >10,000 individuals where the SNP was genotyped directly (111).
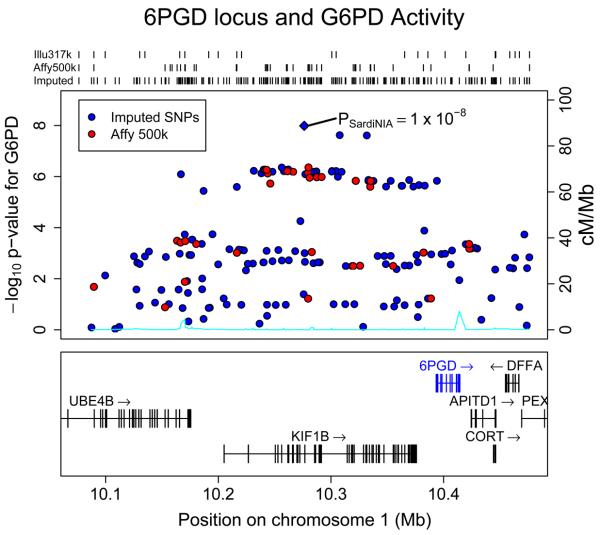
The figure illustrates evidence for association between genetic variants near 6PGD and measurements of G6PD activity using data from the SardiNIA study (94). Evidence for association at each SNP, measured as −log10 P-value, is represented along the y-axis. The placement of each SNP along the X axis corresponds to assigned chromosomal location in the current genome build. Results for directly genotype SNPs are colored in red, imputed SNPs are colored in blue. Note that although there is evidence for association in the region prior to imputation, the signal increases substantially, to reach genomewide significance, after imputation. The connection between 6PGD activity and measurements of G6PD activity is long established (13).
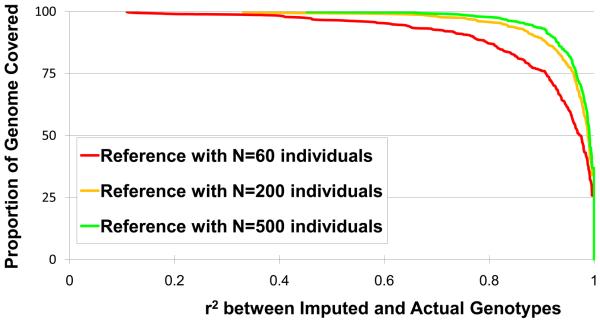
The accuracy of imputation increases with the number of individuals in the reference panel. To generate the figure, we analyzed genotyped data from the FUSION study (93). For any given r2 threshold, the results illustrate the proportion of markers whose genotypes can be imputed with equal or greater accuracy. The results illustrate how the proportion of markers whose genotypes are recovered accurately (with high r2 between imputed and actual genotypes) increases with larger reference panels.
References
Publication types
MeSH terms
Grants and funding
LinkOut - more resources
Full Text Sources
Other Literature Sources
Molecular Biology Databases
