Comparative Study
. 2009 Aug 28:10:407.
doi: 10.1186/1471-2164-10-407.

Reproducibility of quantitative RT-PCR array in miRNA expression profiling and comparison with microarray analysis

Affiliations
Comparative Study

Reproducibility of quantitative RT-PCR array in miRNA expression profiling and comparison with microarray analysis

Yongxin Chen et al. BMC Genomics. .

Abstract

Background: MicroRNAs (miRNAs) have critical functions in various biological processes. MiRNA profiling is an important tool for the identification of differentially expressed miRNAs in normal cellular and disease processes. A technical challenge remains for high-throughput miRNA expression analysis as the number of miRNAs continues to increase with in silico prediction and experimental verification. Our study critically evaluated the performance of a novel miRNA expression profiling approach, quantitative RT-PCR array (qPCR-array), compared to miRNA detection with oligonucleotide microchip (microarray).

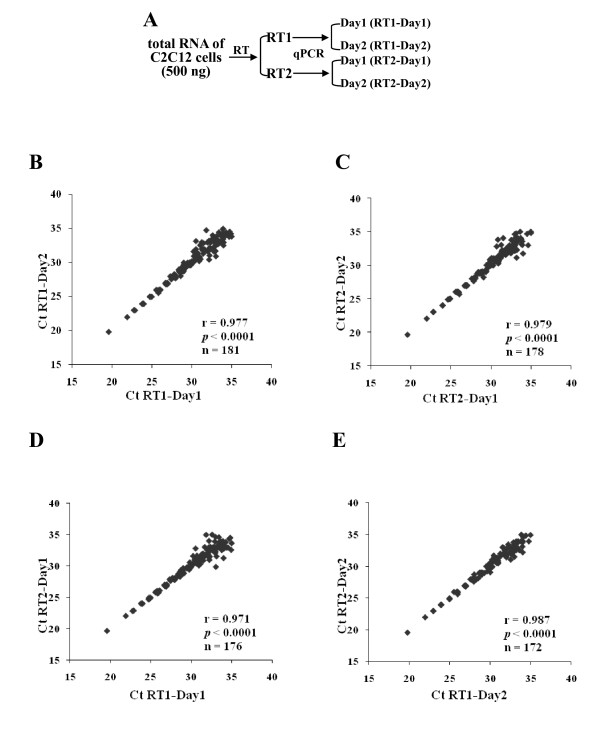
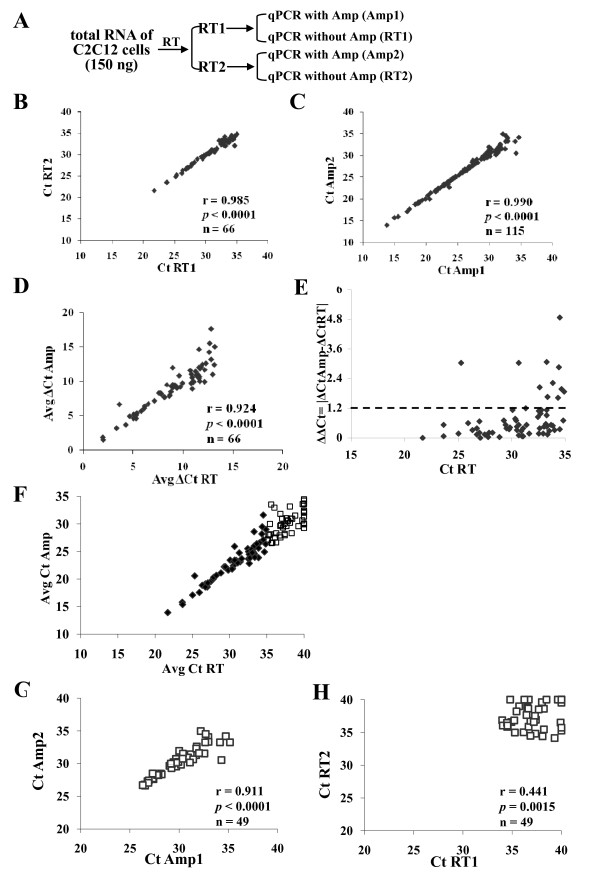
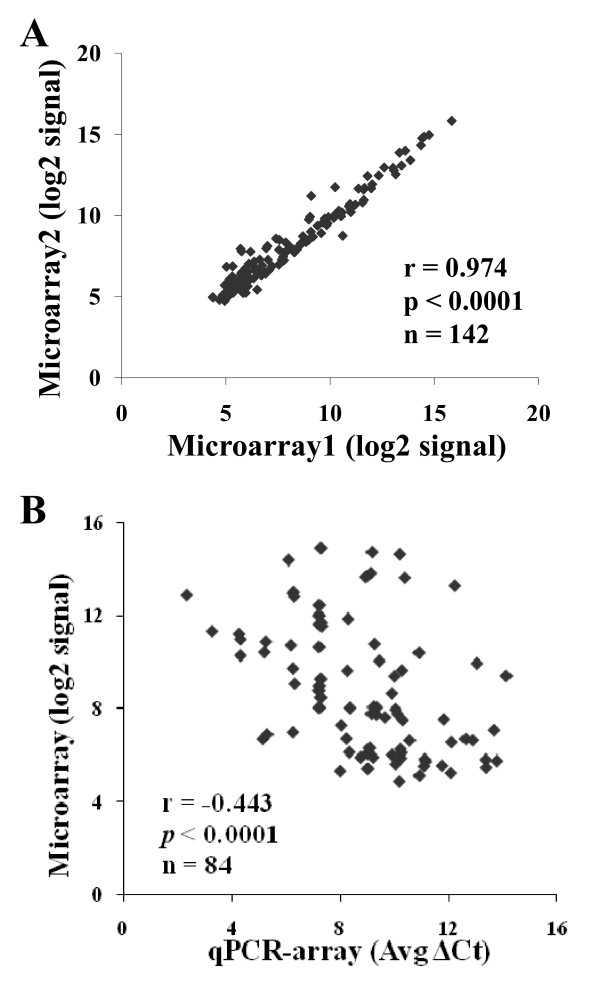
Results: High reproducibility with qPCR-array was demonstrated by comparing replicate results from the same RNA sample. Pre-amplification of the miRNA cDNA improved sensitivity of the qPCR-array and increased the number of detectable miRNAs. Furthermore, the relative expression levels of miRNAs were maintained after pre-amplification. When the performance of qPCR-array and microarrays were compared using different aliquots of the same RNA, a low correlation between the two methods (r=-0.443) indicated considerable variability between the two assay platforms. Higher variation between replicates was observed in miRNAs with low expression in both assays. Finally, a higher false positive rate of differential miRNA expression was observed using the microarray compared to the qPCR-array.

Conclusion: Our studies demonstrated high reproducibility of TaqMan qPCR-array. Comparison between different reverse transcription reactions and qPCR-arrays performed on different days indicated that reverse transcription reactions did not introduce significant variation in the results. The use of cDNA pre-amplification increased the sensitivity of miRNA detection. Although there was variability associated with pre-amplification in low abundance miRNAs, the latter did not involve any systemic bias in the estimation of miRNA expression. Comparison between microarray and qPCR-array indicated superior sensitivity and specificity of qPCR-array.


Figures

Figure 1
Figure 1
Experimental design and reproducibility of qPCR-array. A, The same RNA (500 ng) was used in two different reverse transcription (RT) reactions and the products were used in qPCR-arrays performed on different days. B and C, inter-assay reproducibility as determined by comparison of raw Ct values between replicates of different day reactions. D and E, inter-sample reproducibility as determined by comparison of raw Ct values between replicates of different RT reactions. Corresponding r and p values were determined by linear regression analysis. Sample number presented in each plot.
Figure 2
Figure 2
Experimental design and comparison of miRNA expression between samples with and without pre-amplification. A, The same RNA (150 ng) was used in the reverse transcription (RT) and pre-amplification reactions. B and C, correlation plot between raw Ct values for each replicate with (Amp) or without (RT) pre-amplification. D, correlation plot of ΔCt obtained with and without pre-amplification. E, difference in miRNA expression (ΔΔCt) between amplified and non-amplified samples. ΔΔCt values were plotted as the average Ct of non-amplified samples. F, correlation plot between raw Ct values obtained with and without pre-amplification. Data points represented by white dots indicate miRNAs that were only detectable in pre-amplified samples. G and H, correlation plot of Ct values of miRNAs detected only in pre-amplified samples between replicates with and without pre-amplification. Corresponding r and p value determined by linear regression analysis and sample number presented in each plot.
Figure 3
Figure 3
Reproducibility of microarray and comparison of miRNA expression between microarray and qPCR-array. A, correlation plot of log2 signals between the duplicate microarray assays. B, correlation plot comparing the ΔCt values of qPCR-array with the log2 of the microarray signal for each miRNA (n = 84). Corresponding r and p value determined by linear regression analysis.

Similar articles

Cited by

References

    1. Cannell IG, Kong YW, Bushell M. How do microRNAs regulate gene expression? Biochem Soc Trans. 2008;36:1224–1231. doi: 10.1042/BST0361224. - DOI - PubMed
    1. Eulalio A, Huntzinger E, Izaurralde E. Getting to the root of miRNA-mediated gene silencing. Cell. 2008;132:9–14. doi: 10.1016/j.cell.2007.12.024. - DOI - PubMed
    1. Xie W, Ted Brown W, Denman RB. Translational regulation by non-protein-coding RNAs: different targets, common themes. Biochem Biophys Res Commun. 2008;373:462–466. doi: 10.1016/j.bbrc.2008.06.075. - DOI - PubMed
    1. Bartel DP. MicroRNAs: genomics, biogenesis, mechanism, and function. Cell. 2004;116:281–297. doi: 10.1016/S0092-8674(04)00045-5. - DOI - PubMed
    1. Ambros V. The functions of animal microRNAs. Nature. 2004;431:350–355. doi: 10.1038/nature02871. - DOI - PubMed

Publication types

MeSH terms

LinkOut - more resources