

In vivo glutamate decline associated with kainic acid-induced status epilepticus
- PMID: 19715683
- PMCID: PMC2783661
- DOI: 10.1016/j.brainres.2009.08.060
In vivo glutamate decline associated with kainic acid-induced status epilepticus
Abstract
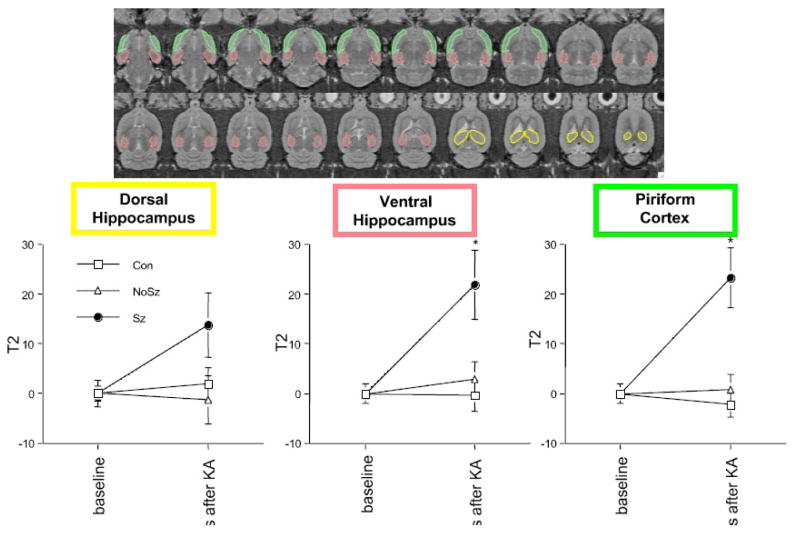
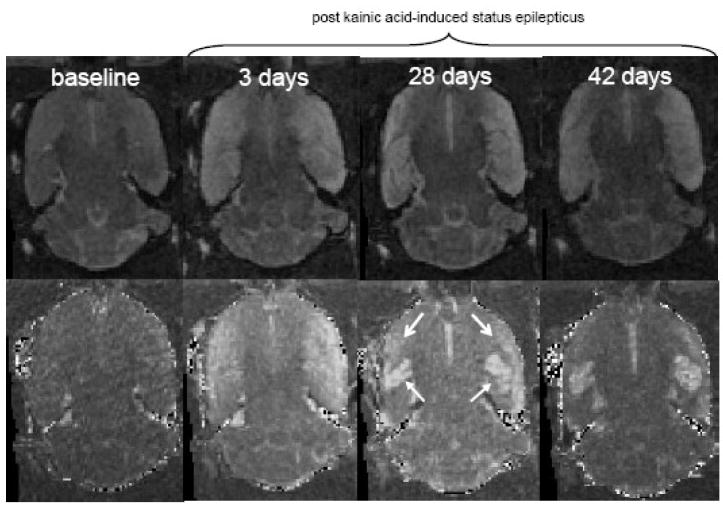
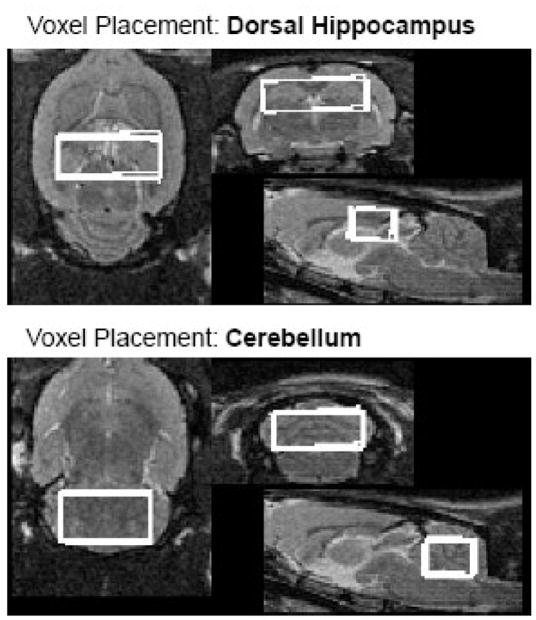
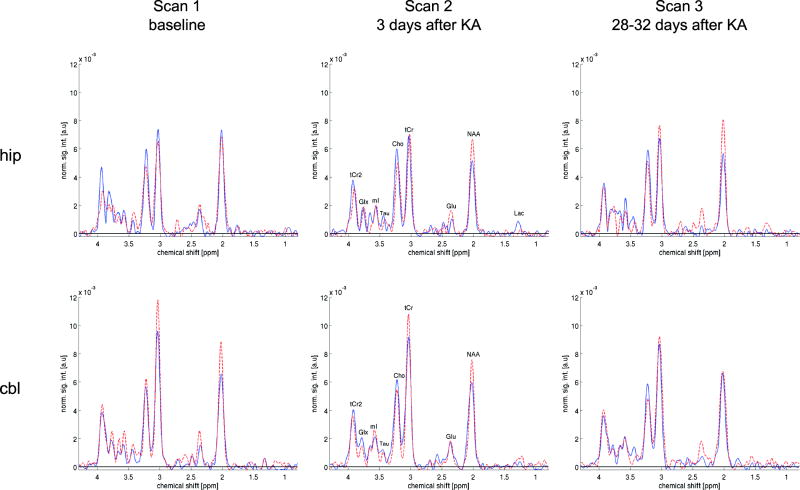
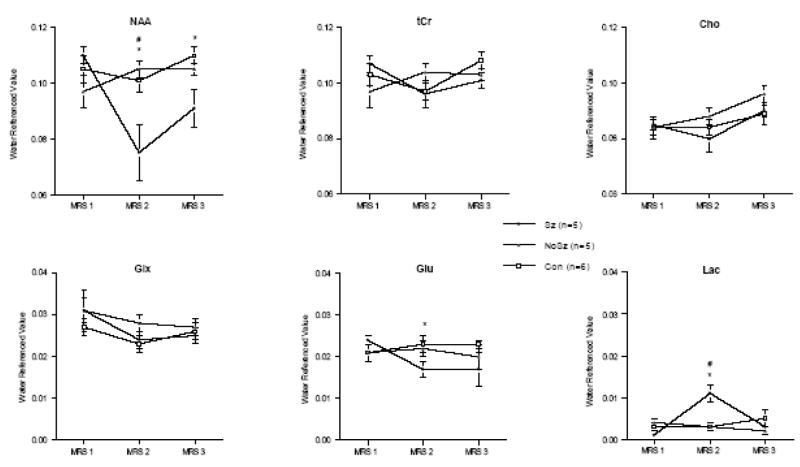
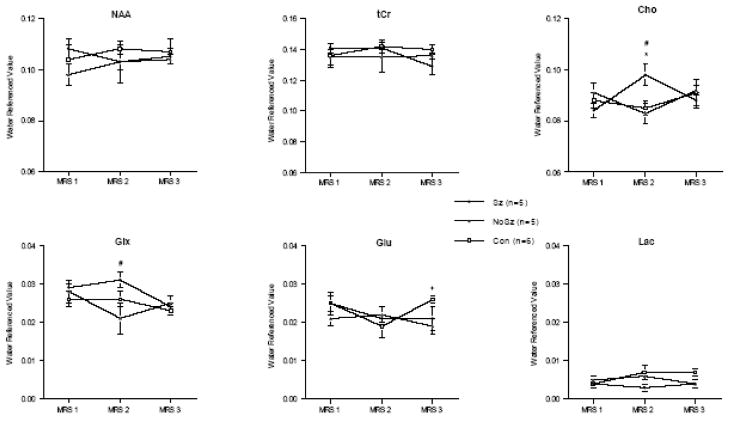
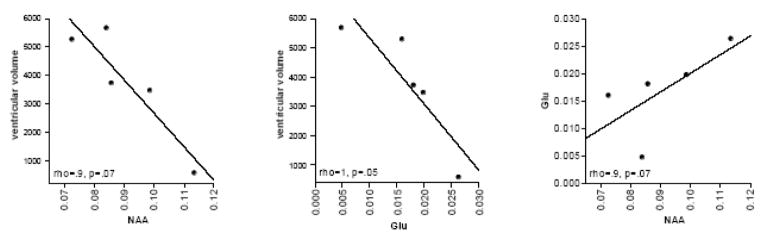
Neurophysiological, biochemical, and anatomical evidence implicates glutamatergic mechanisms in epileptic seizures. Until recently, however, longitudinal characterization of in vivo glutamate dynamics was not possible. Here, we present data using in vivo magnetic resonance spectroscopy (MRS) optimized for the detection of glutamate to identify changes that evolve following kainic acid (KA)-induced status epilepticus. Wild-type male Wistar rats underwent whole-brain MR imaging and single-voxel MRS on a clinical 3 T scanner equipped with a high-strength insert gradient coil. Scanning took place before and then 3 days, 28-32 days, and 42-50 days after induction of status epilepticus. Analyses compared 5 seizure (Sz), 5 no-seizure (NoSz; received KA but did not exhibit seizures), and 6 control (Con) animals. This longitudinal study demonstrated reduced glutamate levels in vivo in the dorsal hippocampus 3 days and 1 month following status epilepticus in Sz animals compared with Con animals. Additionally, previous results were replicated: in the Sz group, computed T2 was higher in the ventral hippocampus and limbic cortex 3 days after seizure activity compared with baseline but resolved in both regions at the 1 month scan, suggesting a transient edema. Three days following seizure activity, N-acetylaspartate (NAA) declined and lactate increased in the dorsal hippocampus of the Sz group compared with the Con and NoSz group; both metabolites approached baseline levels by the third scan. Taken together, these results support the conclusion that seizure activity following KA infusion causes loss of glutamatergic neurons.
Figures
References
-
- Adalsteinsson E, Sullivan EV, Pfefferbaum A. Biochemical, Functional and Microstructural Magnetic Resonance Imaging (MRI) In: Liu Y, Lovinger DM, editors. Methods in Alcohol-Related Neuroscience Research. CRC Press; Boca Raton, FL: 2002. pp. 345–372.
-
- Adalsteinsson E, Hurd RE, Mayer D, Sailasuta N, Sullivan EV, Pfefferbaum A. In vivo 2D J-resolved magnetic resonance spectroscopy of rat brain with a 3-T clinical human scanner. Neuroimage. 2004;22:381–6. - PubMed
-
- Alvestad S, Hammer J, Eyjolfsson E, Qu H, Ottersen OP, Sonnewald U. Limbic structures show altered glial-neuronal metabolism in the chronic phase of kainate induced epilepsy. Neurochem Res. 2008;33:257–66. - PubMed
-
- Bates JF, Peake L, Swearengen ES, Hall TW, Standish LJ. CL 218–872 pretreatment and intervention block kainate-induced convulsions and neuropathology. Behav Neurosci. 1988;102:84–92. - PubMed
-
- Ben-Ari Y, Tremblay E, Riche D, Ghilini G, Naquet R. Electrographic, clinical and pathological alterations following systemic administration of kainic acid, bicuculline or pentetrazole: metabolic mapping using the deoxyglucose method with special reference to the pathology of epilepsy. Neuroscience. 1981;6:1361–91. - PubMed
Publication types
MeSH terms
Substances
Grants and funding
LinkOut - more resources
Full Text Sources
