. 2010 Jan 1;49(1):930-8.
doi: 10.1016/j.neuroimage.2009.08.041. Epub 2009 Aug 26.

High gamma mapping using EEG

Affiliations

High gamma mapping using EEG

F Darvas et al. Neuroimage. .

Abstract

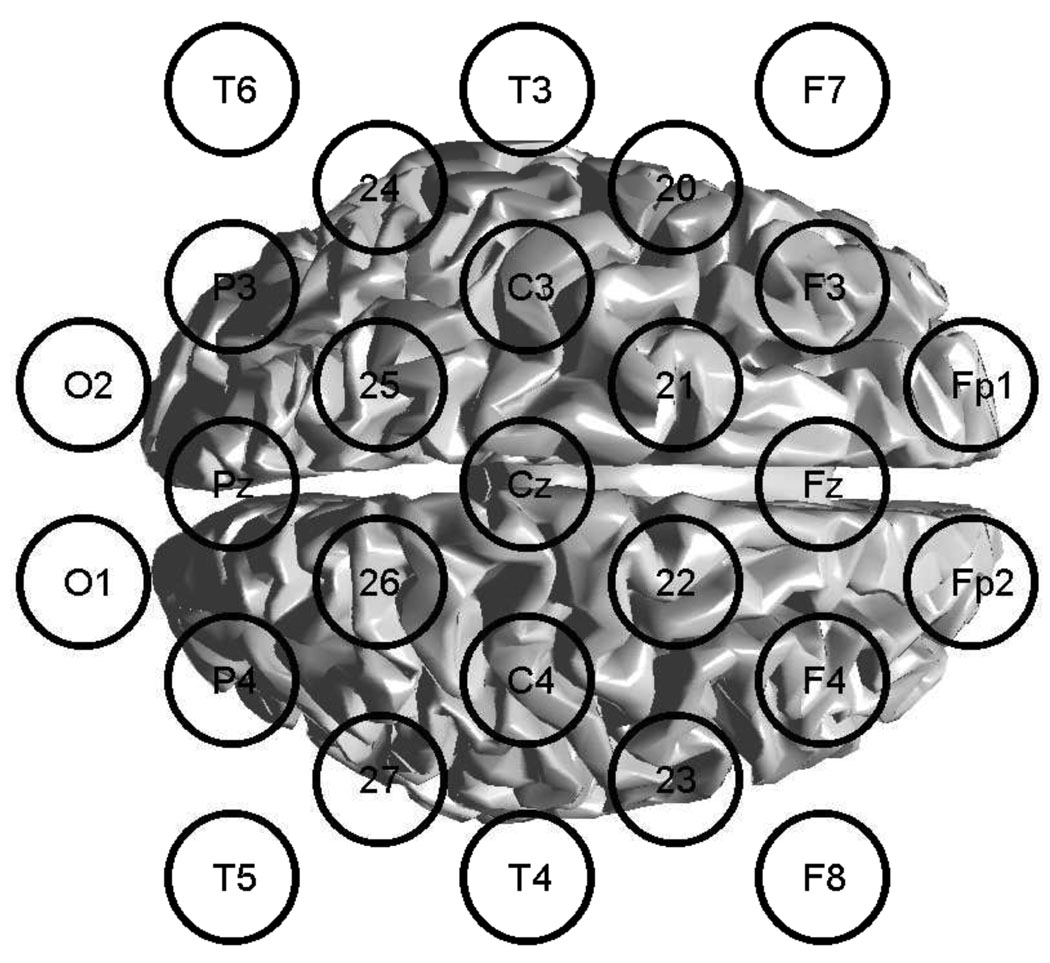
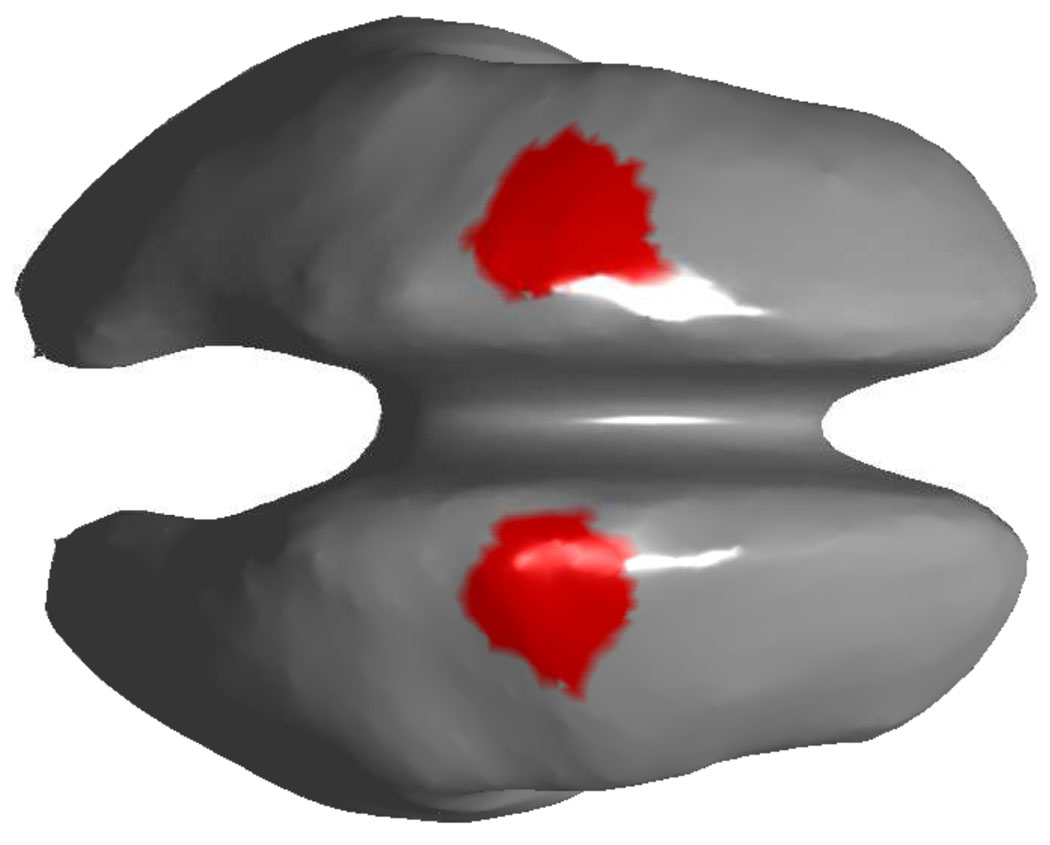
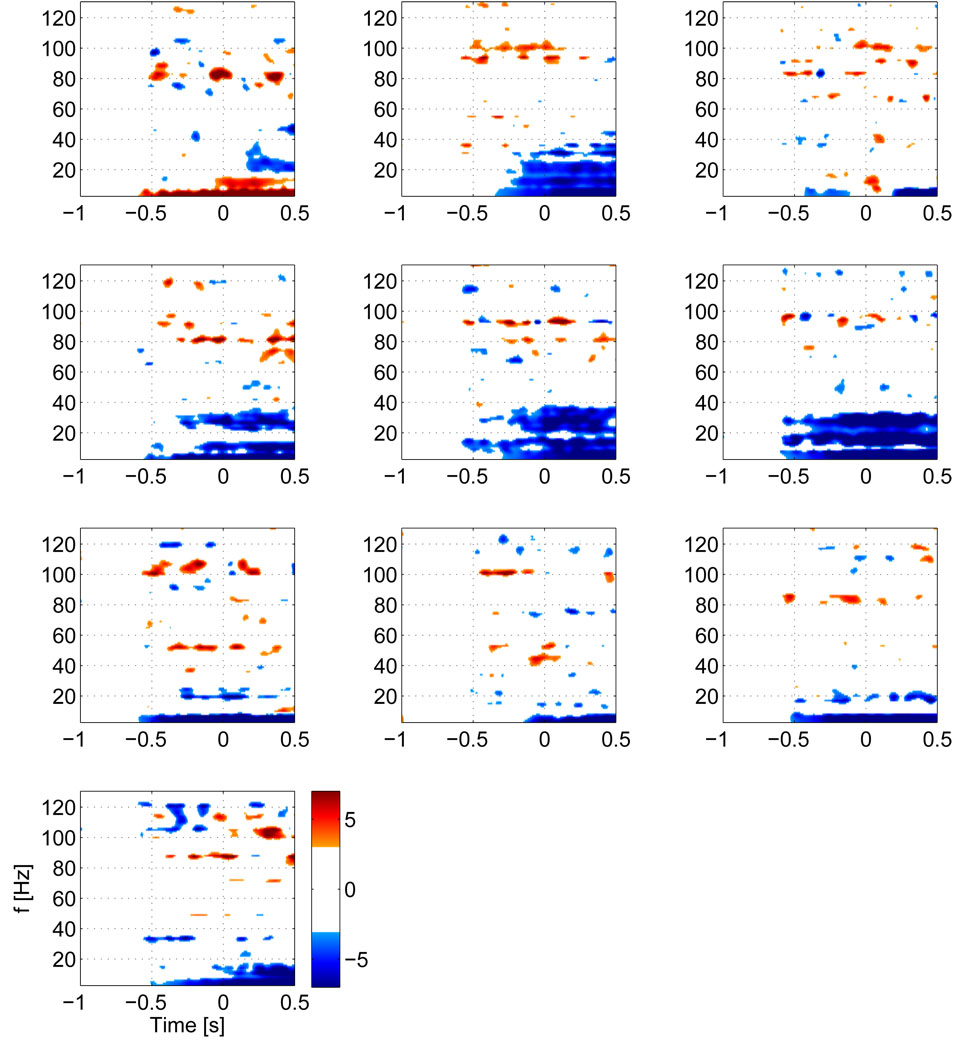
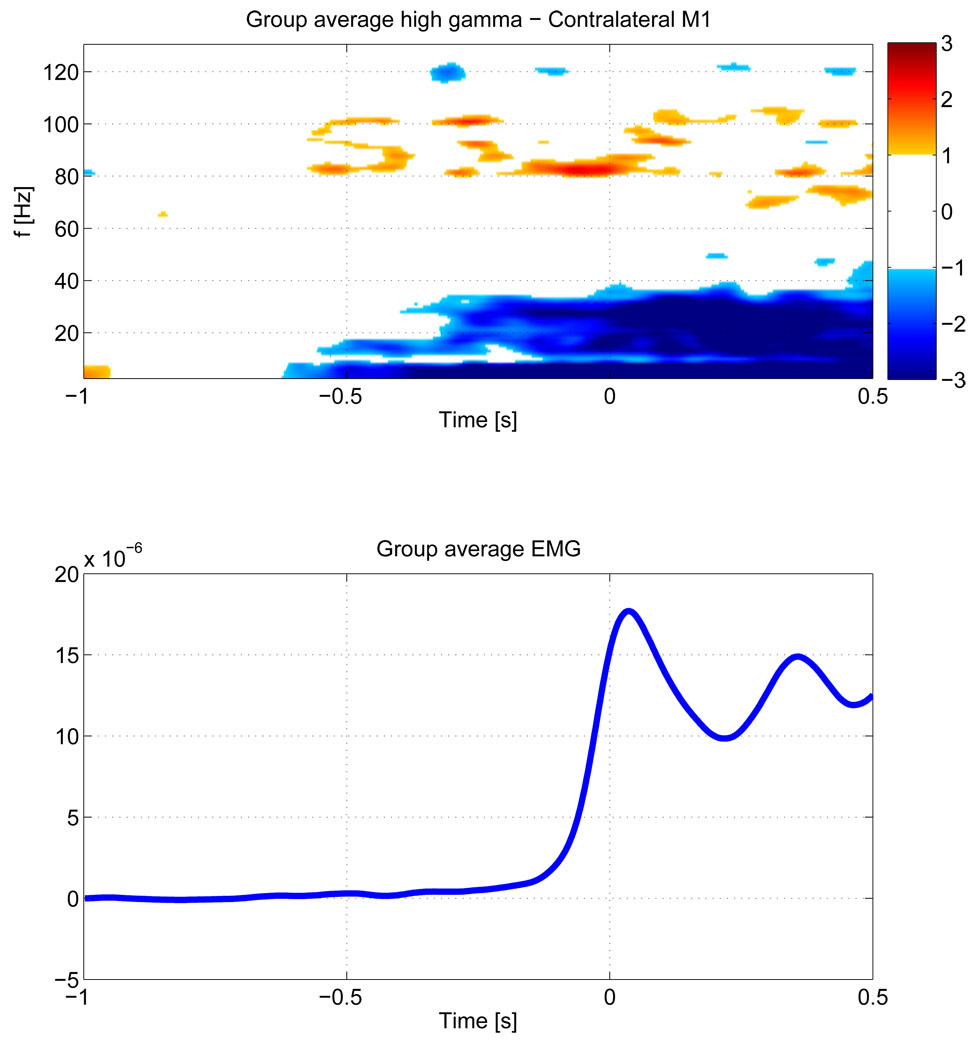
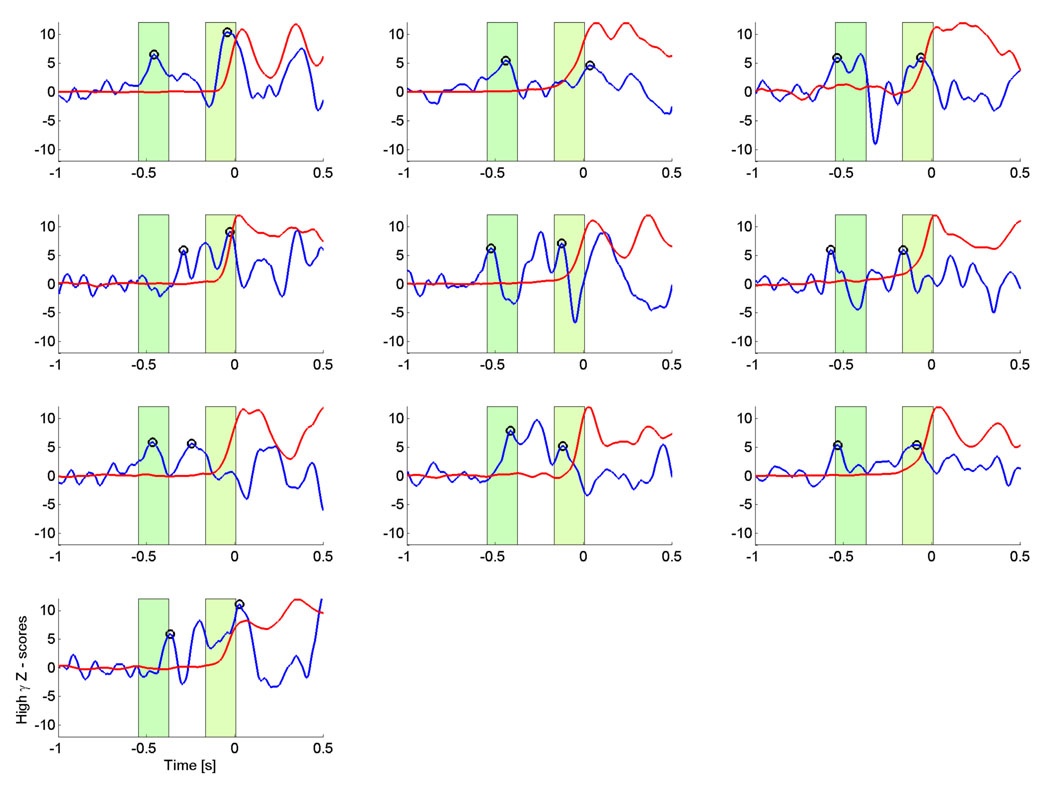
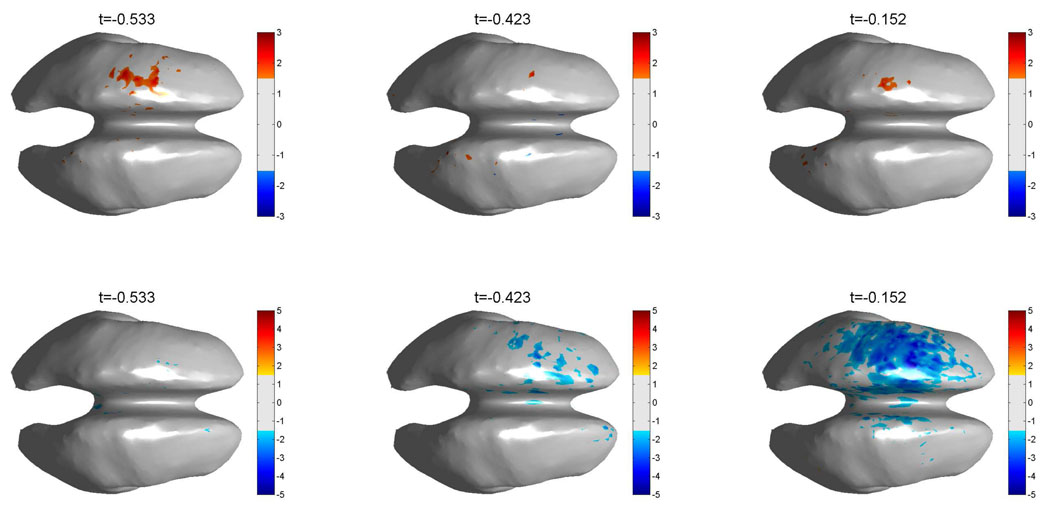
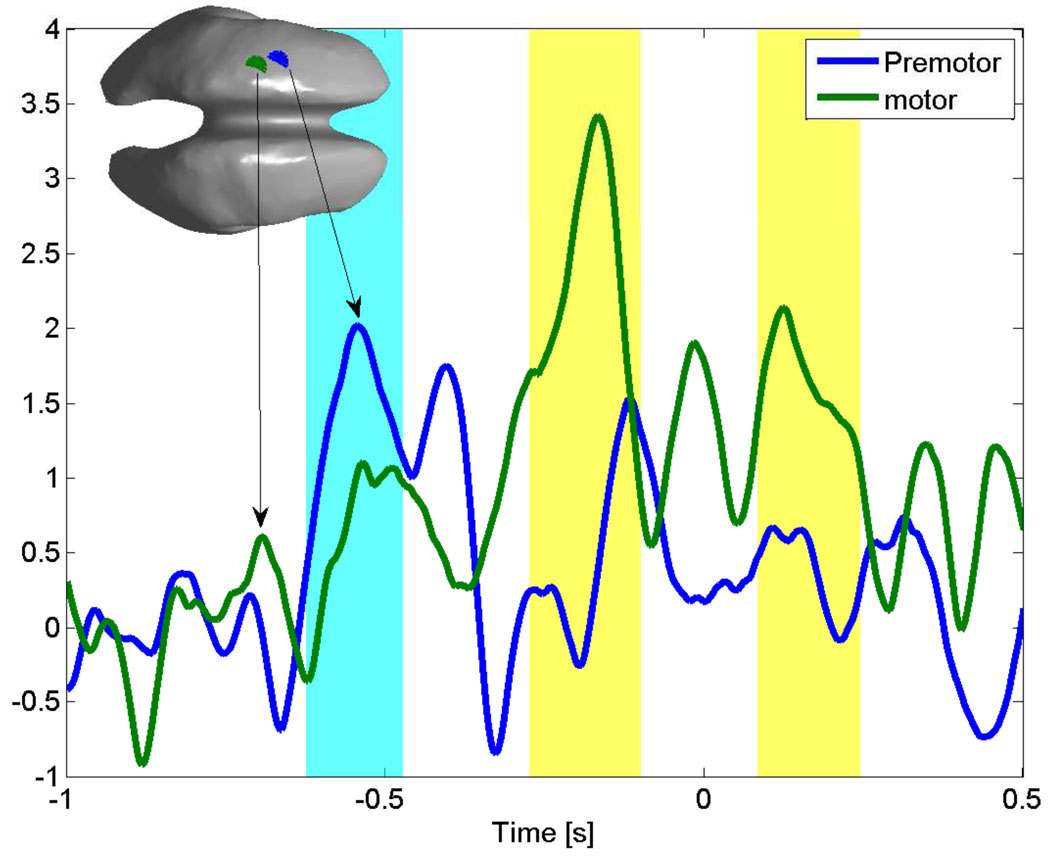
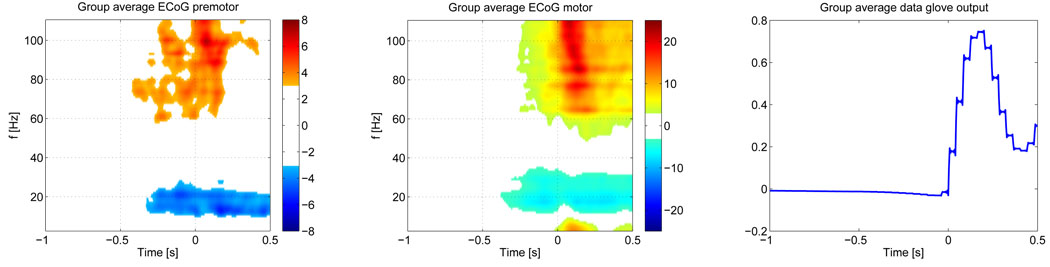
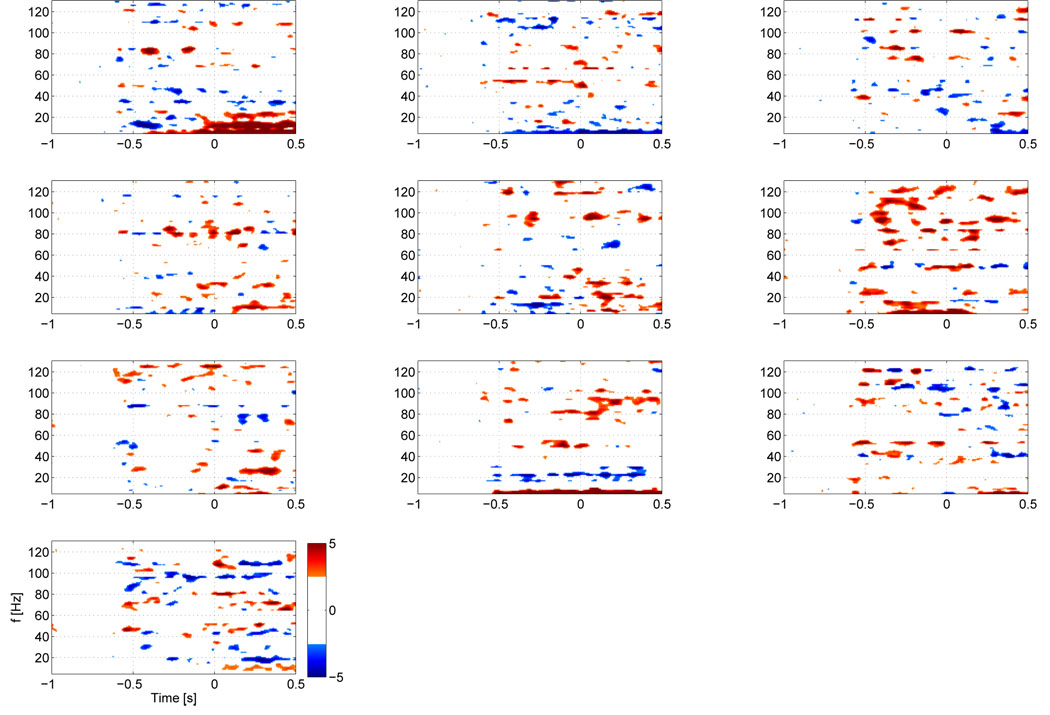
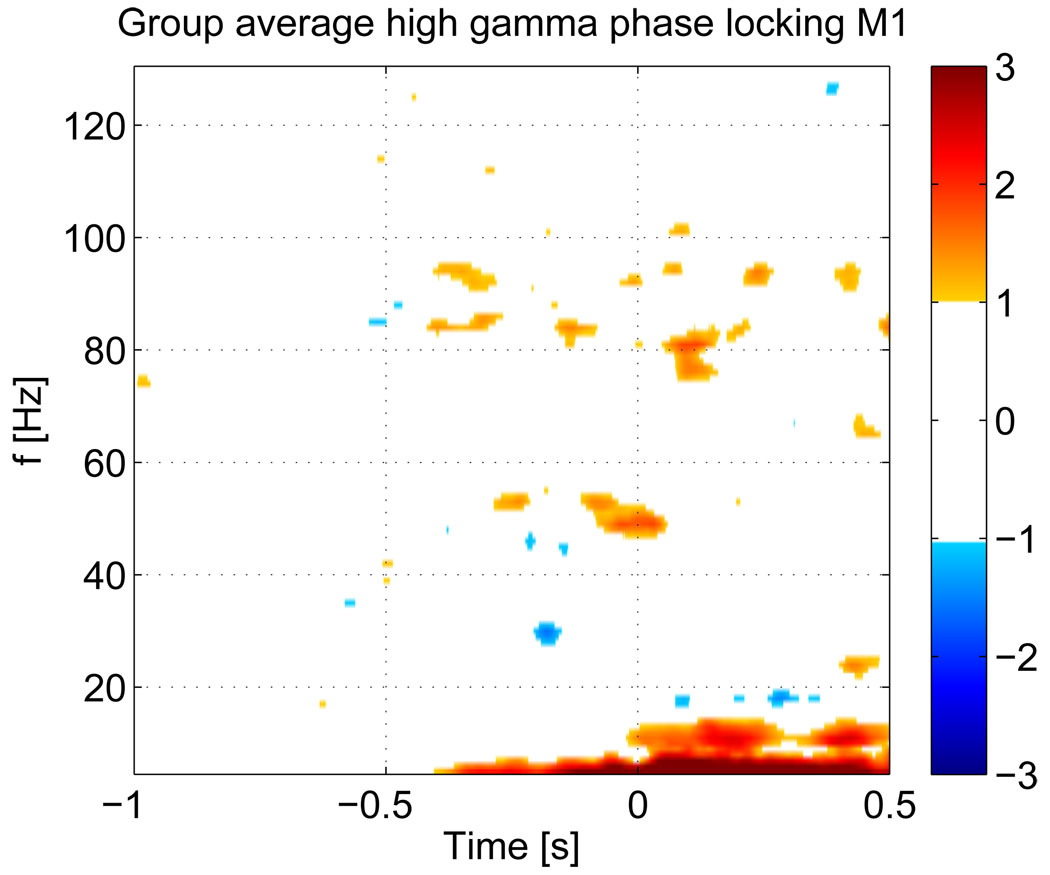
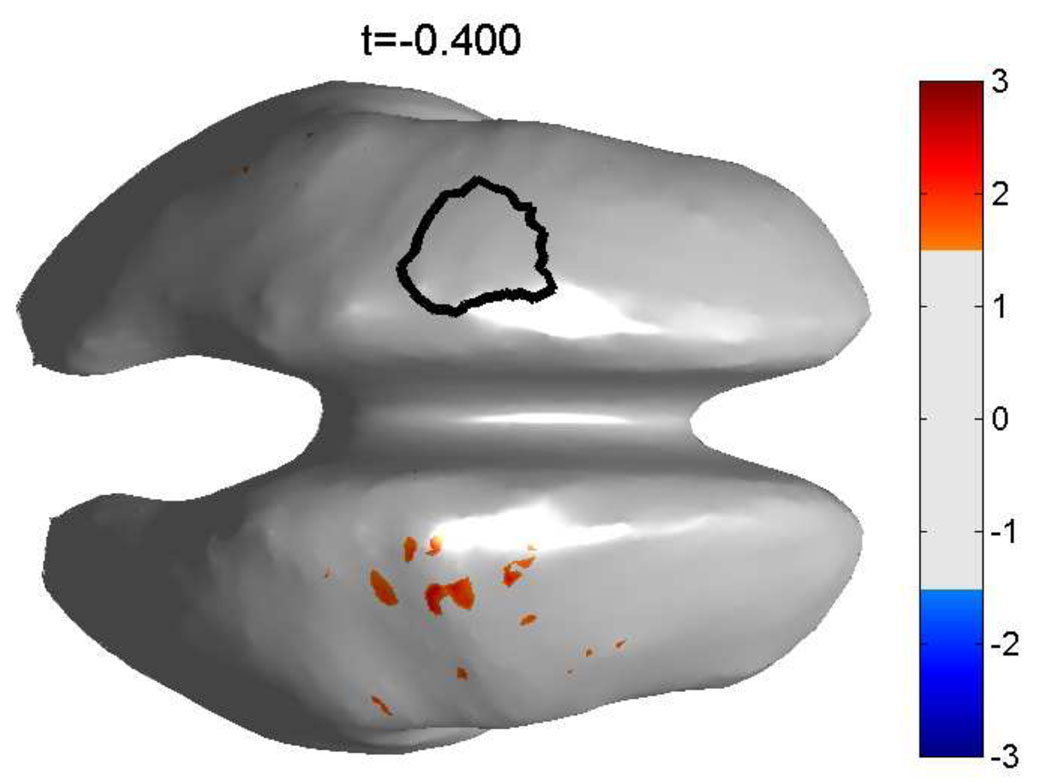
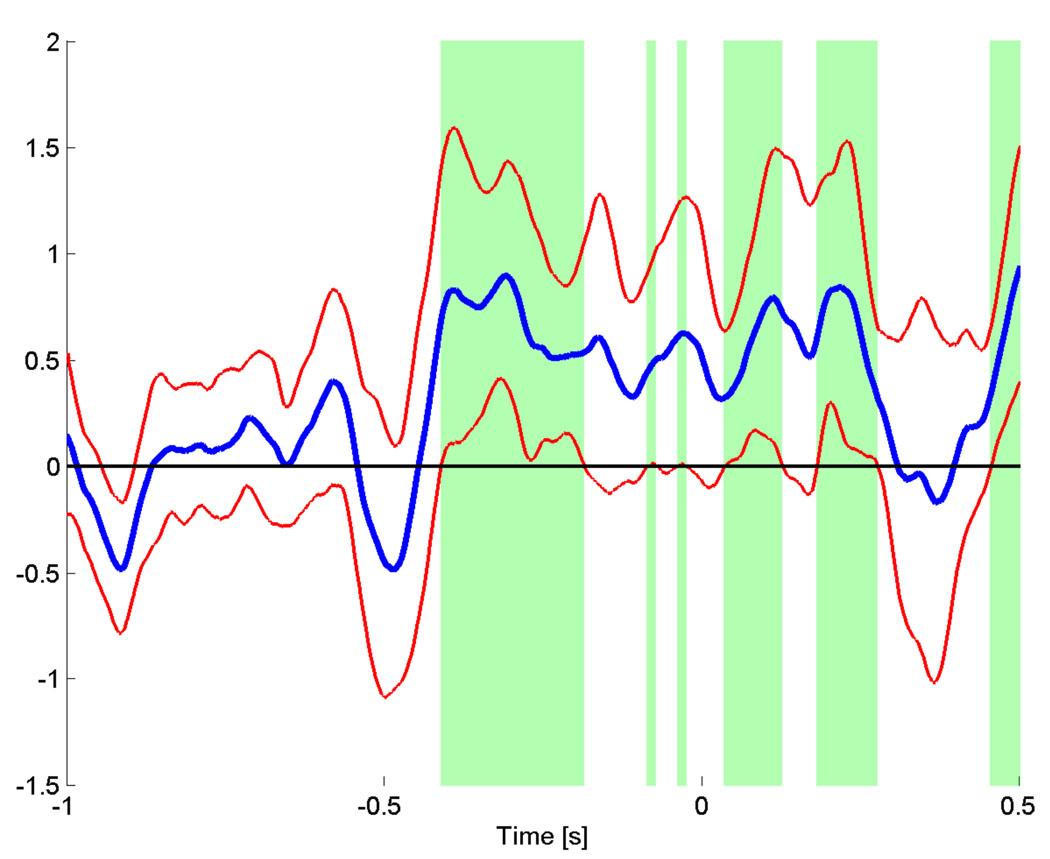
High gamma (HG) power changes during motor activity, especially at frequencies above 70 Hz, play an important role in functional cortical mapping and as control signals for BCI (brain-computer interface) applications. Most studies of HG activity have used ECoG (electrocorticography) which provides high-quality spatially localized signals, but is an invasive method. Recent studies have shown that non-invasive modalities such as EEG and MEG can also detect task-related HG power changes. We show here that a 27 channel EEG (electroencephalography) montage provides high-quality spatially localized signals non-invasively for HG frequencies ranging from 83 to 101 Hz. We used a generic head model, a weighted minimum norm least squares (MNLS) inverse method, and a self-paced finger movement paradigm. The use of an inverse method enables us to map the EEG onto a generic cortex model. We find the HG activity during the task to be well localized in the contralateral motor area. We find HG power increases prior to finger movement, with average latencies of 462 ms and 82 ms before EMG (electromyogram) onset. We also find significant phase-locking between contra- and ipsilateral motor areas over a similar HG frequency range; here the synchronization onset precedes the EMG by 400 ms. We also compare our results to ECoG data from a similar paradigm and find EEG mapping and ECoG in good agreement. Our findings demonstrate that mapped EEG provides information on two important parameters for functional mapping and BCI which are usually only found in HG of ECoG signals: spatially localized power increases and bihemispheric phase-locking.


Figures

Figure 1
Figure 1
Schematic view of the expanded 10–20 system and the generic cortex surface used for EEG data acquisition.
Figure 2
Figure 2
Left and right motor area region of interest on the generic cortex. The cortex surface has been smoothed for better visibility. We use these areas to compute TF maps for HG activation and to compute interhemispheric phase-locking in the HG band.
Figure 3
Figure 3
Z-score TF maps for each subject for activity in the contralateral motor area. Note that subject 1, whose map is shown in the top left corner was left handed and performed a left index finger movement, hence activity in the right motor area is shown. All other subjects were right handed and hence all other maps show activity for the left motor area. The maps have a threshold at ‖Z‖ ≥ 3, which corresponds to an uncorrected p-value ≤ 0.01. The individual maps show, that all subjects have significant pre-movement HG increases in a narrow band.
Figure 4
Figure 4
Group average of the Z-score TF maps across all subjects (top) and the mean EMG activity at 72–105 Hz (bottom). The threshold for the Z-score map is set at ‖Z‖ ≥ 1. Since we average over nine subjects this threshold corresponds to 3 std which is equivalent to an uncorrected p ≤ 2.3 * 10−5. The group average also shows significant pre-movement HG increase across all subjects.
Figure 5
Figure 5
Time course of the HG activity (blue) for the strongest voxels and peak frequencies in the contralateral motor area. Activity has been converted to Z-scores, based on the −1 s to −0.6 s interval. The red curves show the scaled mean EMG power at the same frequencies. Most subjects show HG activity curves with an early and a late increase. Black circles indicate the earliest and the latest peak of HG activity prior to EMG onset. The green shaded areas indicate the time interval corresponding to the mean +/− 1 std of the peak time across all subjects. This implies that for all subjects, the peak HG activity takes place at two distinct latencies prior to EMG onset.
Figure 6
Figure 6
Group average maps for all right handed subjects (n = 9). The top row shows the average HG activity across all subjects for three pre EMG onset latencies. The bottom row shows the corresponding beta band (15–35 Hz) activity. The band power maps for each subject have been converted to Z-scores, based on the −1 s to −0.6 s interval, prior to averaging. A threshold of ‖Z‖ ≥ 1.5 is used for both, HG and beta band activity. Note that, since we average over nine subjects, only values exceeding 4.5 std are shown, corresponding to an uncorrected p ≤ 2 * 10−10 for each voxel. These maps show, that HG and Beta band changes in the motor areas are the dominant activity.
Figure 7
Figure 7
Time series for the premotor (blue line) and motor area (green line) of the group average HG activity. The shaded areas (cyan for the premotor activity and yellow for motor activity) indicate the times, where the lower bound of the 95% confidence interval for each time series exceeds the mean baseline activity. The inset shows the position of the premotor (blue) and motor (green) voxels on the generic cortex. The premotor area activity peak (blue) precedes the motor area (green) peak.
Figure 8
Figure 8
Group averagemaps for the motor and premotor areas as recorded by ECoG for cued index finger movements (n = 7). The left figure shows the Z-score map for the premotor electrodes. The middle figure shows motor activity. The band power maps for each subject have been converted to Z-scores, based on the −1 s to −0.6 s interval, prior to averaging. A threshold of ‖Z‖ ≥ 3 is used for both areas, corresponding to 8 std of the baseline. The right figure shows the mean data glove output across all subjects. Our ECoG shows premotor/motor HG activity patterns that are similar to our EEG.
Figure 9
Figure 9
Phase locking maps for interhemispheric synchronization between the left and right motor areas. Phase locking was computed between all voxels in the left and right motor areas and then averaged over all pairs. The PLV values have been converted to Z-scores based on the −1 s to −0.6 s interval. The threshold for the Z-score map is set at ‖Z‖ ≥ 3. Unlike the individual HG power changes, the PLV increases for individual subjects are not limited to the HG range and show a much greater variation across subejcts.
Figure 10
Figure 10
Group average of the mean PLV for all subjects. The threshold for the Z-score map is set at ‖Z‖ ≥ 1. Note that ,since we average over ten subjects, only values exceeding 3.16 std are shown, corresponding to an uncorrected p ≤ 10−5 for each voxel. In contrast to individual results, the group average shows that phase-locking is limited to the HG range.
Figure 11
Figure 11
Map of the group average over all subjects for the PLV between all voxels in the left hemispheric ROI and the right hemispheric ROI. The threshold is set at ‖Z‖ ≥ 1.5, corresponding to 4.5 std or an uncorrected p-value of p ≤ 2 * 10−10 for each voxel. The left hemispheric ROI, outlined in black, was used as the seed region. The map shows that synchronization from the seed area to the right motor area is the only significant synchronization at this latency (400 ms before movement onset).
Figure 12
Figure 12
Group average time course of the PLV between the left and right hemispheric motor areas, averaged from 81 to 95 Hz. Red lines indicate the lower and upper 5% confidence interval across subjects. The green areas indicate times where the lower 5% confidence interval of the PLV Z-score exceeds the mean Z-score of the baseline (−1 s to −0.6 s).The synchronization between left and right motor area peaks at −400 ms and stays high until 275 ms after the EMG onset.

References

    1. Ball T, Demandt E, Mutschler I, Neitzel E, Mehring C, Vogt K, Aertsen A, Schulze-Bonhage A. Movement related activity in the high gamma range of the human eeg. NeuroImage. 2008;41(2):302–310. - PubMed
    1. Blakely T, Miller K, Zanos S, Rao RN, Ojemann JG. Robust, long-term control of an electrocorticographic brain-computer interface with fixed parameters. Neurosurgical Focus. 2009 in press. - PubMed
    1. Brunner C, Graimann B, Huggins JE, Levine SP, Pfurtscheller G. Phase relationships between different subdural electrode recordings in man. Neurosci Lett. 2005;375(2):69–74. - PubMed
    1. Cheyne D, Bells S, Ferrari P, Gaetz W, Bostan AC. Self-paced movements induce high-frequency gamma oscillations in primary motor cortex. NeuroImage. 2008;42(1):332–342. - PubMed
    1. Collins DL, Zijdenbos AP, Kollokian V, Sled JG, Kabani NJ, Holmes CJ, Evans AC. Design and construction of a realistic digital brain phantom. IEEE Trans Med Imaging. 1998;17(3):463–468. - PubMed

Publication types

LinkOut - more resources