Comparative Study
. 2009 Sep 8;106(36):15454-9.
doi: 10.1073/pnas.0813216106. Epub 2009 Aug 26.

Unexpected expression of alpha- and beta-globin in mesencephalic dopaminergic neurons and glial cells

Affiliations
Comparative Study

Unexpected expression of alpha- and beta-globin in mesencephalic dopaminergic neurons and glial cells

Marta Biagioli et al. Proc Natl Acad Sci U S A. .

Abstract

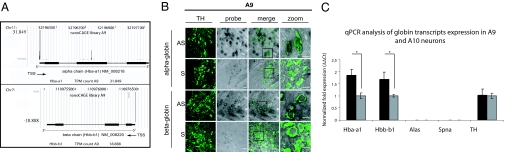
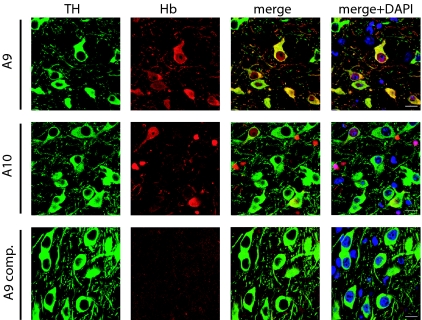
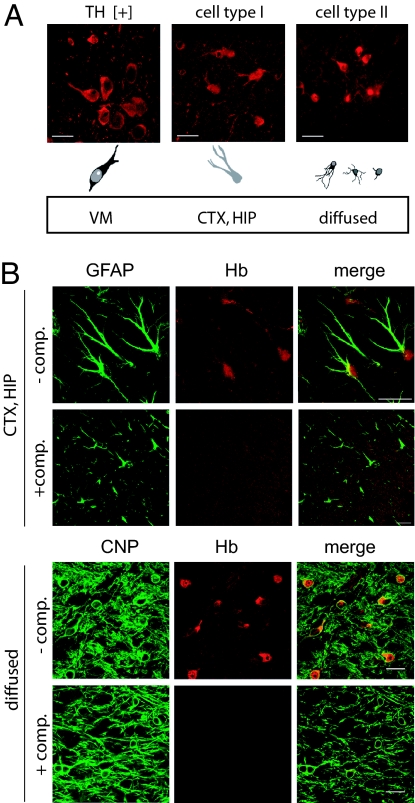
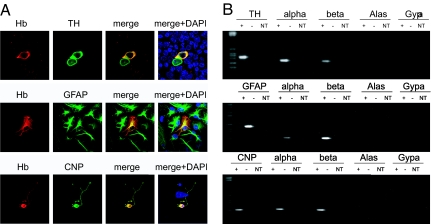
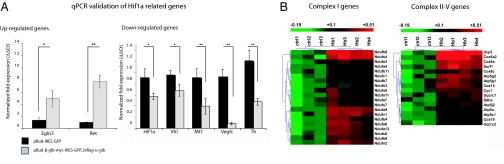
The mesencephalic dopaminergic (mDA) cell system is composed of two major groups of projecting cells in the substantia nigra (SN) (A9 neurons) and the ventral tegmental area (VTA) (A10 cells). A9 neurons form the nigrostriatal pathway and are involved in regulating voluntary movements and postural reflexes. Their selective degeneration leads to Parkinson's disease. Here, we report that gene expression analysis of A9 dopaminergic neurons (DA) identifies transcripts for alpha- and beta-chains of hemoglobin (Hb). Globin immunoreactivity decorates the majority of A9 DA, a subpopulation of cortical and hippocampal astrocytes and mature oligodendrocytes. This pattern of expression was confirmed in different mouse strains and in rat and human. We show that Hb is expressed in the SN of human postmortem brain. By microarray analysis of dopaminergic cell lines overexpressing alpha- and beta-globin chains, changes in genes involved in O(2) homeostasis and oxidative phopshorylation were observed, linking Hb expression to mitochondrial function. Our data suggest that the most famed oxygen-carrying globin is not exclusively restricted to the blood, but it may play a role in the normal physiology of the brain and neurodegenerative diseases.


Conflict of interest statement

The authors declare no conflict of interest.

Figures

Fig. 1.
Fig. 1.
Expression of α- and β-globin transcripts in A9 and A10 neurons. (A) NanoCAGE tracks visualization concerning Hbb-a1 (Chr.11) and Hbb-b1 (Chr.7) gene loci. A Genome Browser view is presented. A9 library is indicated, and the tags per million (TPM) for each gene are reported. The structure of Hbb-a1 and Hbb-b1 transcripts is depicted at the bottom. Transcriptional start sites (TSS) are indicated at the 5′ untranscribed region of each transcript. (B) In situ hybridization of α- and β-globin transcripts on A9 DA neurons: ventral midbrain slices were processed with antisense (AS) and sense (S) probes for the two globins transcripts. DA neurons were visualized by immunohistochemistry using an anti-TH antibody (green). The overlay (merge) shows colocalization of the transcripts of α- and β-globin in the cytoplasm of A9 neurons. Probes synthesis from sense transcripts were used as negative controls. The zoom offers magnifications of the area in the boxes of the overlay images. (Scale bars: 20 μm.) (C) qPCR starting from 500 LCM-isolated neurons from A9 (black column) and A10 (grey column) regions of the ventral midbrain of TH-GFP mice. TH, α-globin, and β-globin transcripts were amplified and the absence of blood contamination was evaluated by using primers for Alas and Spna. α- and β-transcripts are more expressed in A9 neurons (≈2-fold), four biological replicas, P < 0.05.
Fig. 2.
Fig. 2.
Hb protein is expressed in A9 and A10 DA neurons of mouse brain. A double immunohistochemistry analysis using anti-Hb (red), anti-TH (green), and DAPI (blue) is presented: nearly 70% of A9 but only 3% of A10 neurons were double labeled for Hb and TH (merge). Hb staining is present in the nucleus, except for the nucleolus, and in the cytoplasm. Adsorption of the anti-Hb antibody with spleen extract completely prevents Hb staining (A9 comp). (Scale bar: 20 μm.)
Fig. 3.
Fig. 3.
Hb protein is expressed in different regions of the mouse brain. (A) (Upper) Immunohistochemistry using anti-Hb antibody on mouse brain revealed different Hb-IR cells: large neurons located in the ventral midbrain, positive for TH (TH+); cell type I large cells located in the cortex (CTX) and hippocampus (HIP); and cell type II small cells, widely diffused in all of the brain regions tested and presenting a strong Hb-IR. (Scale bars: 20 μm.) (Lower) A schematic representation of the morphologies of Hb-IR cells is presented. (B) Double immunohistochemistry using anti-Hb antibody (red) together with astrocytes and oligodendrocytes markers (GFAP and CNP, green). (Upper) In the cortex (CTX) and in the hippocampus (HIP), Hb–IR cell type I colocalizes with GFAP staining. (Lower) Hb-IR cell type II colocalizes with the oligodendrocytes marker CNP. Adsorption of the anti-Hb antibody with spleen extract completely prevents Hb staining (+ comp). (Scale bars: 20 μm.)
Fig. 4.
Fig. 4.
Primary cultures of DA neurons, astrocytes, and oligodendrocytes: immunofluorescence and RT-PCR. (A) Immunofluorescence on primary cultures of DA neurons, cortical and hippocampal astrocytes, and oligodendrocytes. (Magnification: 63×.) Specific cell population markers (green) and Hb staining (red) are shown. (B) RT-PCR results obtained from 2,000 single FACS-sorted cells. α- and β-globin transcripts and the population-specific markers (TH, GFAP, and CNP, respectively) were amplified (+). The absence of blood contamination was evaluated by using primers for Alas and Gypa. Negative controls, retrotranscriptase free (−), and no-template control samples (NT) are presented. RNA extracted from blood was used as positive control (Fig. S9).
Fig. 5.
Fig. 5.
Array analysis of Hb overexpressing mouse dopaminergic cell line reveals changes in the expression of genes involved in O2 homeostasis and mitochondrial oxidative phosphorylation. (A) Genes involved in Hif1a pathway are presented. qPCR experiments of selected genes, up-regulated (Left) and down-regulated (Right), validate array data. (B) Genes involved in mitochondrial oxidative phosphorylation pathway. Heat maps of genes components of complex I (Left) and complexes II–V (Right) are presented.

Similar articles

Cited by

References

    1. Hirsch E, Graybiel AM, Agid YA. Melanized dopaminergic neurons are differentially susceptible to degeneration in Parkinson's disease. Nature. 1988;334:345–348. - PubMed
    1. Meyer-Lindenberg A, et al. Reduced prefrontal activity predicts exaggerated striatal dopaminergic function in schizophrenia. Nat Neurosci. 2002;5:267–271. - PubMed
    1. Grimm J, Mueller A, Hefti F, Rosenthal A. Molecular basis for catecholaminergic neuron diversity. Proc Natl Acad Sci USA. 2004;101:13891–13896. - PMC - PubMed
    1. Chung CY, et al. Cell type-specific gene expression of midbrain dopaminergic neurons reveals molecules involved in their vulnerability and protection. Hum Mol Genet. 2005;14:1709–1725. - PMC - PubMed
    1. Greene JG, Dingledine R, Greenamyre JT. Gene expression profiling of rat midbrain dopamine neurons: Implications for selective vulnerability in parkinsonism. Neurobiol Dis. 2005;18:19–31. - PubMed

Publication types

Associated data