. 2009 Dec 1;18(23):4501-12.
doi: 10.1093/hmg/ddp410. Epub 2009 Aug 28.

Common fragile sites are characterized by histone hypoacetylation

Affiliations

Common fragile sites are characterized by histone hypoacetylation

Yanwen Jiang et al. Hum Mol Genet. .

Abstract

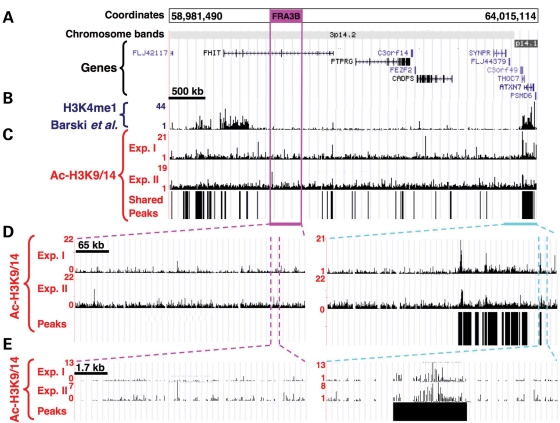
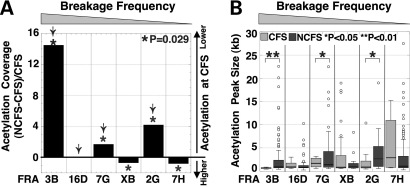
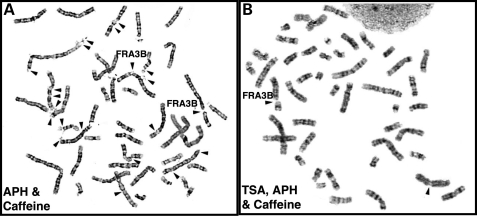
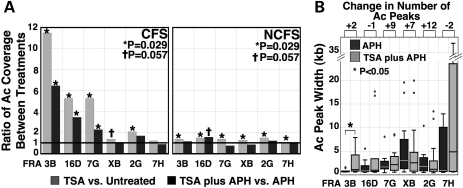
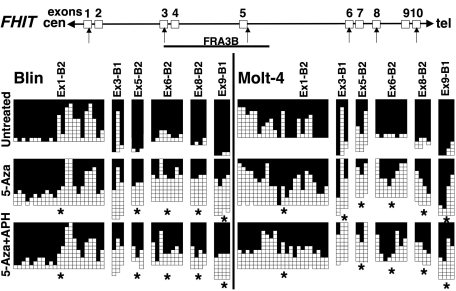
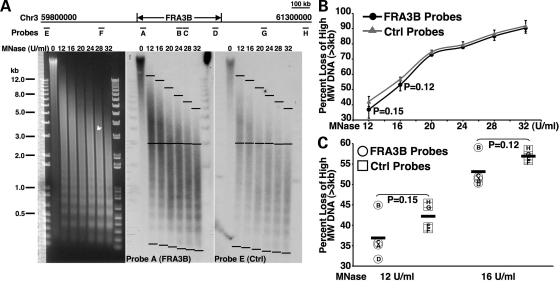
Common fragile sites (CFSs) represent large, highly unstable regions of the human genome. CFS sequences are sensitive to perturbation of replication; however, the molecular basis for the instability at CFSs is poorly understood. We hypothesized that a unique epigenetic pattern may underlie the unusual sensitivity of CFSs to replication interference. To examine this hypothesis, we analyzed chromatin modification patterns within the six human CFSs with the highest levels of breakage, and their surrounding non-fragile regions (NCFSs). Chromatin at most of the CFSs analyzed has significantly less histone acetylation than that of their surrounding NCFSs. Trichostatin A and/or 5-azadeoxycytidine treatment reduced chromosome breakage at CFSs. Furthermore, chromatin at the most commonly expressed CFS, the FRA3B, is more resistant to micrococcal nuclease than that of the flanking non-fragile sequences. These results demonstrate that histone hypoacetylation is a characteristic epigenetic pattern of CFSs, and chromatin within CFSs might be relatively more compact than that of the NCFSs, indicating a role for chromatin conformation in genomic instability at CFSs. Moreover, lack of histone acetylation at CFSs may contribute to the defective response to replication stress characteristic of CFSs, leading to the genetic instability characteristic of this regions.


Figures

Figure 1.
Figure 1.
Genomic map, and results of chromatin structure analysis within FRA3B. (A) Chromosome coordinates corresponding to the NCBI build 35, chromosome band and location of the annotated genes. The position of the CFS within the arrayed region is represented by the burgundy box. (B) Screenshot from the UCSC genome browser showing ChIP-Seq data with antibody for H3K4me1. (C) Screenshot from the UCSC genome browser showing ChIP-on-chip data for the lymphoblastoid cell line, 11 365, using anti-Ac-H3K9/14 antibody, displayed as the linear ratio of ChIP-on-chip sample fluorescence to input DNA fluorescence. The location of the mapped acetylated chromatin domains shared between two independent ChIP experiments is represented by vertical bars under the ChIP-on-chip data. (D, E) Screenshot of ChIP-on-chip data of zoomed-in sections within the CFS (left panels) or the NCFS sequences (right panels), with shared peaks (black bars) shown underneath.
Figure 2.
Figure 2.
Acetylation coverage at CFSs and flanking NCFS regions. (A) The graph illustrates the fold change in acetylation coverage of flanking NCFS regions versus each respective CFS. The arrow indicates those CFSs with less than 4% acetylation coverage. The order of the CFSs on the X-axis is shown in decreasing order of the frequency of fragile site expression, which is used in the figures throughout. (B) The distribution of the size of the acetylated chromatin domains (in kb) is represented as a box plot for each CFS (light gray plots) and NCFS (dark gray plots) region. The circles correspond to outlying data points, i.e. more than 1.5 times the inter-quartile range higher than the third quartile value. Of note, for presentation purposes, one outlier data point corresponding to a 55 kb domain within FRA7H CFS is not represented on the graph. The asterisks indicate a significant difference in the distribution of the size of the acetylated chromatin domains between CFSs and NCFSs (*, P < 0.05; **, P < 0.01).
Figure 3.
Figure 3.
TSA treatment decreases fragile site expression. PHA-stimulated lymphocytes were treated either with 0.4 µm APH for the last 24 h (left panel), or with 1.0 µm TSA and 0.4 µm APH for the last 24 h (right panel). Caffeine (1.5 µm) was added 4 h prior to metaphase cell preparation. Arrows identify breaks at CFSs.
Figure 4.
Figure 4.
TSA increases histone H3K9/14 acetylation within CFSs. (A) H3K9/14 acetylation coverage increases within CFSs following TSA treatment. The ratios of the acetylation coverage between various treatments were calculated for the CFS sequences (left panel) and the flanking NCFS sequences (right panel). Statistical significance is calculated based on the exact permutation test (*, P = 0.029; †, P = 0.057). (B) Comparison of the distribution of acetylation peak width in APH-treated and TSA plus APH-treated cells. Box plots show the distribution of the acetylation peak width for each CFS following the indicated treatment (*, P < 0.05). The absolute gain (or loss) in the number of the acetylated peaks for each CFS is listed above the figure. For presentation purposes, an outlier in the FRA7H in the APH-treated sample is omitted due to its large size (∼55 kb).
Figure 5.
Figure 5.
5-Aza treatment decreases CpG methylation of FRA3B sequences. Bisulfite sequencing of the FHIT/FRA3B locus in untreated Blin and Molt-4 cells, and cells treated with 0.2 µm 5-Aza for 72 h, or 5-Aza and APH (added 24 h prior to harvest). Each row presents a clone. Filled squares indicate methylated CpGs, whereas open squares refer to unmethylated CpGs. Primer sequences are listed in Supplementary Material, Table S4. The genomic structure of the FHIT/FRA3B locus is illustrated at the top of the panel, and the regions examined are indicated by arrows. Stars indicate regions that had a significant decrease (P < 0.05) of CpG methylation in treated cells.
Figure 6.
Figure 6.
Chromatin within the FRA3B is less sensitive to MNase. (A) Ethidium bromide-stained gel and Southern blots probed with probe A (FRA3B probe) or probe E (control probe) on DNA prepared from nuclei of 11 365 cells following treatment with increasing doses of MNase. The locations of the probes are illustrated at the top of the panel. (B) The percentage loss of high MW (>3 kb) signal for each lane was calculated by measuring the signal between the top and center black bars, and the total signal between the top and bottom black bars using ImageJ. The measured signals were normalized to the background signals of the blots. The average percentage loss of high MW DNA for either the FRA3B regions (black line) or the control flanking non-fragile sequences (gray line) was graphed against MNase concentrations. (C) The percentage loss of high MW DNA of each individual region when the nuclei were treated with either 12 or 16 U/ml MNase. The black bars indicate the averages.

References

    1. Glover T.W. Common fragile sites. Cancer Lett. 2006;232:4–12. - PubMed
    1. Gorgoulis V.G., Vassiliou L.V., Karakaidos P., Zacharatos P., Kotsinas A., Liloglou T., Venere M., Ditullio R.A., Jr, Kastrinakis N.G., Levy B., et al. Activation of the DNA damage checkpoint and genomic instability in human precancerous lesions. Nature. 2005;434:907–913. (see comment) - PubMed
    1. Lucas I., Palakodeti A., Le Beau M.M. The implications of replication in common fragile site induction. In: Arrieta I., Penagarikano O., Télez M., editors. Fragile Site. Hauppauge, USA: Nova Science Publishers Inc; 2007. pp. 67–98.
    1. Hellman A., Rahat A., Scherer S.W., Darvasi A., Tsui L.C., Kerem B. Replication delay along FRA7H, a common fragile site on human chromosome 7, leads to chromosomal instability. Mol. Cell. Biol. 2000;20:4420–4427. - PMC - PubMed
    1. Le Beau M.M., Rassool F.V., Neilly M.E., Espinosa R., 3rd, Glover T.W., Smith D.I., McKeithan T.W. Replication of a common fragile site, FRA3B, occurs late in S phase and is delayed further upon induction: implications for the mechanism of fragile site induction. Hum. Mol. Genet. 1998;7:755–761. - PubMed

Publication types