. 2009 Oct 16;284(42):28874-84.
doi: 10.1074/jbc.M109.041608. Epub 2009 Aug 28.

A quantification of pathway components supports a novel model of Hedgehog signal transduction

Affiliations

A quantification of pathway components supports a novel model of Hedgehog signal transduction

Shohreh F Farzan et al. J Biol Chem. .

Abstract

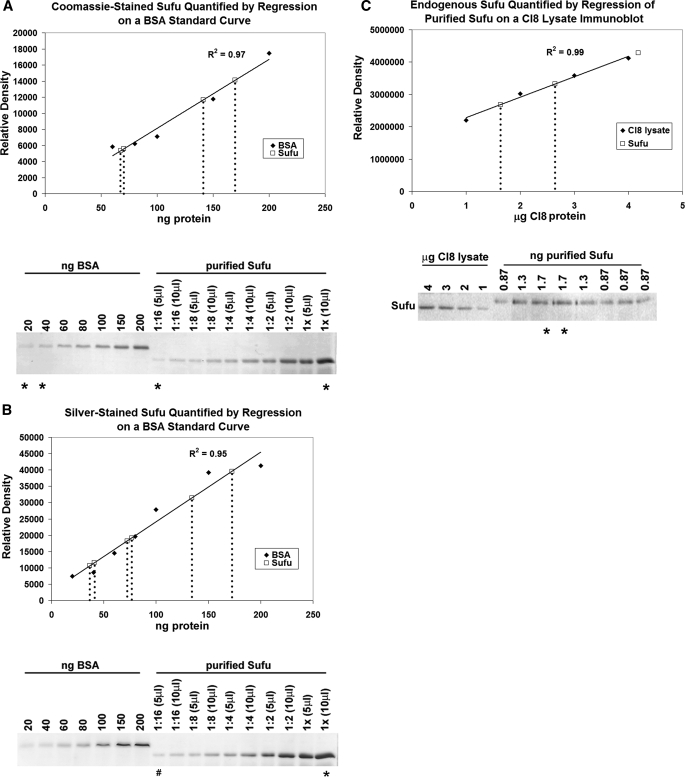
The secreted protein Hedgehog (Hh) plays a critical instructional role during metazoan development. In Drosophila, Hh signaling is interpreted by a set of conserved, downstream effectors that differentially localize and interact to regulate the stability and activity of the transcription factor Cubitus interruptus. Two essential models that integrate genetic, cell biological, and biochemical information have been proposed to explain how these signaling components relate to one another within the cellular context. As the molar ratios of the signaling effectors required in each of these models are quite different, quantitating the cellular ratio of pathway components could distinguish these two models. Here, we address this important question using a set of purified protein standards to perform a quantitative analysis of Drosophila cell lysates for each downstream pathway component. We determine each component's steady-state concentration within a given cell, demonstrate the molar ratio of Hh signaling effectors differs more than two orders of magnitude and that this ratio is conserved in vivo. We find that the G-protein-coupled transmembrane protein Smoothened, an activating component, is present in limiting amounts, while a negative pathway regulator, Suppressor of Fused, is present in vast molar excess. Interestingly, despite large differences in the steady-state ratio, all downstream signaling components exist in an equimolar membrane-associated complex. We use these quantitative results to re-evaluate the current models of Hh signaling and now propose a novel model of signaling that accounts for the stoichiometric differences observed between various Hh pathway components.


Figures

FIGURE 1.
FIGURE 1.
Two current models of Hh signaling. A, one-complex model. B, two-complex model. See text for details. PM, plasma membrane; VM, vesicular membranes; MT, microtubules; and HSC, Hedgehog signaling complex consisting of Fu, Cos2, and Ci. The various activities of components are indicated by color (red, repressor; green, activator), and CiACT refers to a highly activated state. Sufu (not depicted) is predicted to be cytosolic by these models.
FIGURE 2.
FIGURE 2.
Schematic of quantification method. Flowchart of method used to quantify Hh signaling components. “x” represents any of the core Hh-signaling proteins that were quantified.
FIGURE 3.
FIGURE 3.
Quantification of endogenous Sufu levels in Cl8 cell lysates. A, purified recombinant Sufu was quantified by Coomassie staining various dilutions of the purified sample alongside increasing amounts of BSA, which had been separated by SDS-PAGE (bottom panel). The signal intensity of BSA and purified recombinant Sufu were quantitated by ImageQuant software. The top panel shows the results of this quantitation, with each different amount of BSA plotted against its corresponding density. These BSA density values (♦) were used to generate an equation (y = 90x − 440, R2 = 0.97), from which the concentration of pure recombinant Sufu was calculated. The calculated amounts of Sufu were then also plotted on the line (□). B, purified recombinant Sufu was quantified by silver staining in the same manner as described for Coomassie staining in A. BSA density values (♦) were used to generate an equation (y = 200x + 2850, R2 = 0.95), from which the concentration of pure recombinant Sufu was calculated and plotted on the line (□). C, endogenous levels of Sufu in Cl8 lysate were quantified by comparison to known amounts of purified recombinant Sufu by immunoblotting, and graphically represented in the top panel. A standard curve of Cl8 lysate, which was run in duplicate and the averaged points plotted, was used to generate an equation (y = 631,000x + 1,650,000, R2 = 0.99), to which known amounts of purified recombinant Sufu were compared with determine the amount of Sufu present in 1 μg of Cl8 protein. The amount of endogenous Sufu was calculated to be 9.4 × 10⁻¹⁵ mol of Sufu per 1 μg of Cl8 protein. A representative immunoblot showing the endogenous Sufu signal (left) adjacent to the purified recombinant Sufu signal (right) is shown in the lower panel. In all panels shown, an asterisk represents a point that was excluded from our analyses, because it either did not fall within the standard curve or within the detection range of the ImageQuant software. All points of duplicate concentrations were averaged and plotted as a single point. A pound sign (#) indicates that the point was plotted as an individual value, because a duplicate was not available.
FIGURE 4.
FIGURE 4.
Comparison of Hh signaling components between Drosophila cell lines and Drosophila embryos. A, representative immunoblots showing increasing amounts of Cl8 lysate alongside increasing amounts of S2 cell lysate allow a comparison of the ratio of components present in each. Samples were normalized to protein concentration and increasing volumes of lysates (indicated by gray triangles above), were separated by SDS-PAGE and immunoblotted with antibodies to the indicated Hh signaling component. B, quantitation of the relative levels of each component present in 1 μg (μg) of Cl8 or S2 lysate using ImageQuant software. Sufu is shown on a separate scale, to show differences in the less abundant components (right panel). The relative ratios of components are shown in Table 2. C, representative immunoblots showing increasing amounts of Cl8 lysate alongside increasing amounts of Drosophila embryo lysate allow a comparison of the ratio of components present in each. Samples were normalized to protein concentration, and increasing volumes of lysate (indicated by gray triangles above) were loaded as undiluted samples or dilutions (as indicated by 0.5× or 0.25×). D, quantitation of the relative levels of each component present in 1 μg of Cl8 or embryo lysate using ImageQuant software. Sufu is shown on a separate scale, to show differences in the less abundant components (right panel). The asterisk indicates the relative level of that component in S2s or embryos is significantly different (p ≤ 0.05) in comparison to Cl8s, as calculated by a Student's t test (two-tailed). Standard deviation is indicated by error bars, and a minimum of three replicates per component was used for all calculations.
FIGURE 5.
FIGURE 5.
The bulk of Sufu does not associate with the HSC. A, subcellular fractionation of Cl8 lysate shows differential localization of HSC components in the presence (+) and absence (−) of Hh. In the absence of Hh, Cos2 and Fu, as well as a portion the total Ci, are primarily found in the membrane-enriched fraction (HSP), whereas Sufu is localized primarily in the cytosol. In the presence of Hh, the bulk of these proteins are found in the cytosolic enriched fraction (HSS). Fasciclin1 (Fas1) is a marker of the membrane-enriched fractions, which was also used to validate protein normalization. B, fractionation of the cytosolic enriched HSS on a Superose 12 gel-filtration column shows that Sufu migrates in a manner consistent with it being primarily monomeric. An immunoblot of the even-numbered trichloroacetic acid-precipitated fractions is shown here. The migration of two known protein standards is indicated above the immunoblot.
FIGURE 6.
FIGURE 6.
A minor population of membrane-localized Sufu associates with the HSC. A, Sufu association with Ci is increased in a membrane-enriched fraction. Input lanes indicate the starting material and the “Post-IP Sup” lanes indicate the post-immunoprecipitation supernatant, which contains proteins that were not bound by the antibody-bead complexes. A large amount of Sufu is immunoprecipitated from the HSS and is able to co-precipitate Ci. A small amount of Sufu is immunoprecipitated from the HSP, but is able to co-precipitate a similar amount of Ci, indicating that membrane-associated Sufu binds a greater proportion of the total Ci (compare lanes marked by an asterisk). IgG lanes serve as a control and indicate that immunoprecipitation of Sufu and Ci is specific to the antibody used. B, a small population of Sufu co-migrates with other HSC members from a membrane-enriched fraction. Membrane-associated proteins were extracted from HSP fractions with 0.5 m NaCl and fractionated over a Superose 6 gel-filtration column. The various even-numbered fractions were trichloroacetic acid-precipitated and immunoblotted using the appropriate antibodies. A peak containing Fu, Ci, Cos2, and Sufu is seen in fraction 22, where the previously described population A migrates. Undiluted Cl8 lysate is shown as a standard in Fu, Cos2, and Ci immunoblots. Cl8 lysate diluted to 1/10th of its original concentration is shown as a standard in the Sufu immunoblot (top panel), due to Sufu's higher concentration. C, quantification of the relative ratio of the components observed in population A, shows ∼2 mol of Fu, 1 mol of Cos2, 1 mol of Ci, and 1 mol of Sufu. Immunoblot signals in fraction 22 were quantified with ImageQuant software using Cl8 lysate as a standard (n = 3). Standard deviation is indicated by error bars.

References

    1. Ingham P. W., McMahon A. P. (2001) Genes Dev. 15, 3059–3087 - PubMed
    1. Torroja C., Gorfinkiel N., Guerrero I. (2005) J. Neurobiol. 64, 334–356 - PubMed
    1. McMahon A. P., Ingham P. W., Tabin C. J. (2003) Curr. Top. Dev. Biol. 53, 1–114 - PubMed
    1. Rubin L. L., De Sauvage F. J. (2006) 5, 1026–1033 - PubMed
    1. Robbins D. J., Hebrok M. (2007) EMBO Rep. 8, 451–455 - PMC - PubMed

Publication types

MeSH terms