. 2009 Oct;175(4):1598-609.
doi: 10.2353/ajpath.2009.090462. Epub 2009 Aug 28.

Overexpression of wild-type murine tau results in progressive tauopathy and neurodegeneration

Affiliations

Overexpression of wild-type murine tau results in progressive tauopathy and neurodegeneration

Stephanie J Adams et al. Am J Pathol. 2009 Oct.

Abstract

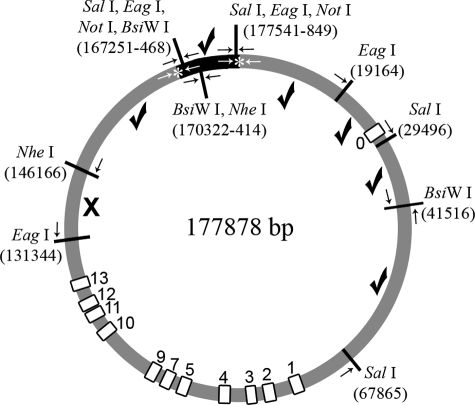
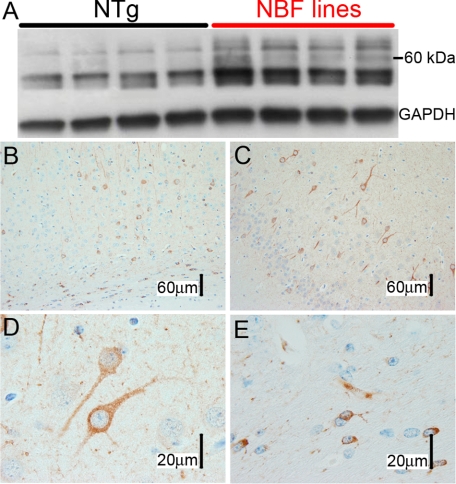
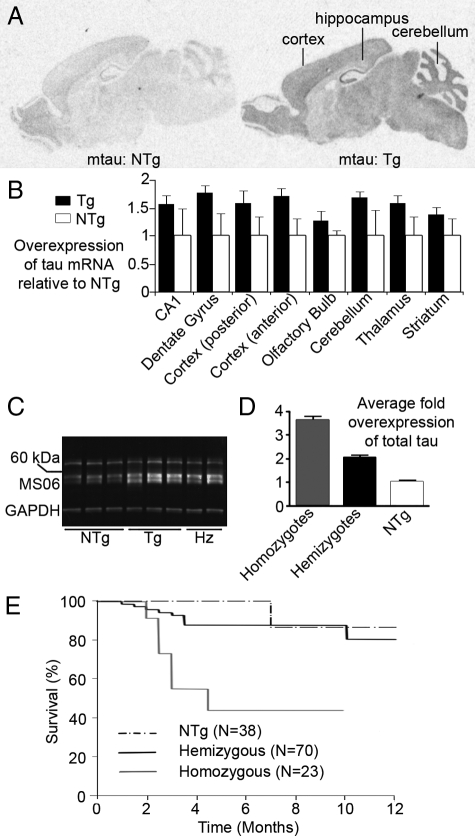
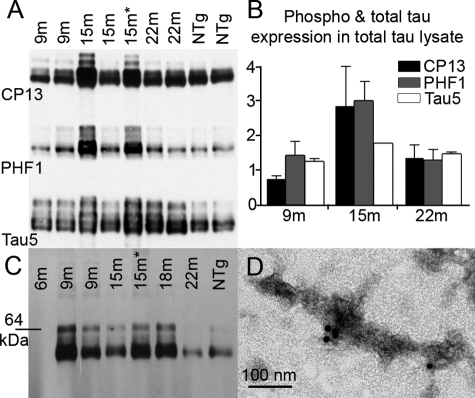
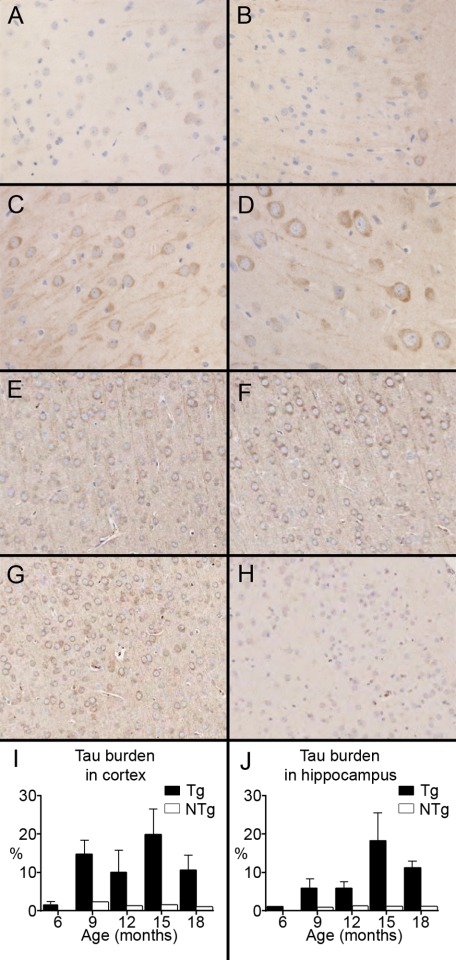
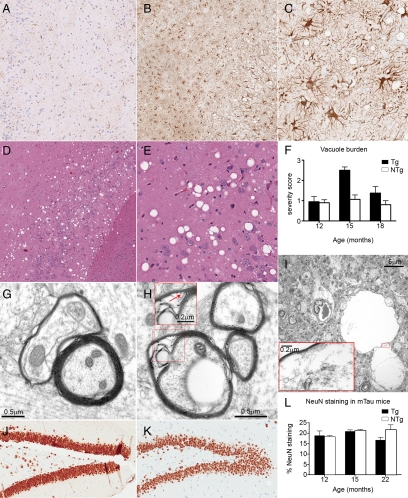
Here, we describe the generation and characterization of a novel tau transgenic mouse model (mTau) that overexpresses wild-type murine tau protein by twofold compared with endogenous levels. Transgenic tau expression was driven by a BAC transgene containing the entire wild-type mouse tau locus, including the endogenous promoter and the regulatory elements associated with the tau gene. The mTau model therefore differs from other tau models in that regulation of the genomic mouse transgene mimics that of the endogenous gene, including normal exon splicing regulation. Biochemical data from the mTau mice demonstrated that modest elevation of mouse tau leads to tau hyperphosphorylation at multiple pathologically relevant epitopes and accumulation of sarkosyl-insoluble tau. The mTau mice show a progressive increase in hyperphosphorylated tau pathology with age up to 15 to 18 months, which is accompanied by gliosis and vacuolization. In contrast, older mice show a decrease in tau pathology levels, which may represent hippocampal neuronal loss occurring in this wild-type model. Collectively, these results describe a novel model of tauopathy that develops pathological changes reminiscent of early stage Alzheimer's disease and other related neurodegenerative diseases, achieved without overexpression of a mutant human tau transgene. This model will provide an important tool for understanding the early events leading to the development of tau pathology and a model for analysis of potential therapeutic targets for sporadic tauopathies.


Figures

Figure 1
Figure 1
Diagram of BAC clone vector containing genomic mouse tau and iPCR experimental design. Created using Vector NTI software, the diagram shows the genomic region of the BAC (gray), the pTAR vector (black), and the locations of mouse tau exons (numbered white boxes), genotyping primers (white arrows) to genomic/vector boundaries (asterisk), and restriction enzyme and primer sites (black arrows) for iPCR, with one primer for each fragment located in the vector. Because inference is drawn from PCRs failing to amplify, BAC DNA was used as a positive control and wild-type mouse DNA was used as a negative control for PCR amplification. All products were sequenced to verify that the amplicons were the specified target product. Using this technique, we determined that the BAC clone linearized somewhere within a 15-kb region starting 7.5 kb downstream of tau (X between EagI and NheI sites) in 12 of the 13 original founders (data not shown).
Figure 2
Figure 2
Non-breeding founders (NBFs). A: Protein expression levels. Immunoblot of NBFs, showing total soluble tau levels compared with NTg mice. Blots were probed with MS06 (mouse tau-specific antibody). NBFs expressed a range of trangenic protein levels up to 2.3-fold over endogenous tau levels based on densitometric analysis. Western results were in agreement with RT-PCR analysis. B–E: Pre-tangle pathology. NBF mice were harvested between 8 and 9 months of age. Immunohistochemistry shows hyperphosphorylated tau (CP13 immunoreactivity) in multiple forebrain areas including the motor cortex (A) and the piriform cortex (B). C: A higher magnification (×100) of B shows granular CP13 tau immunoreactivity in the cytoplasm and neuronal processes consistent with pretangle pathology. Abnormal tau pathology was also evident in oligodendocytes (D). All NBF mice had similar patterns of pretangle pathology in the brain.
Figure 3
Figure 3
Expression of genomic wild-type mouse tau. A: In situ hybridization was performed on sections from 3-month-old mTau Tg and NTg mice. The mTau mice had increased mRNA expression in an identical expression pattern to NTg mice. B: Expression of transgenic tau mRNA ranged from 1.6 to 1.8 over the endogenous tau transcript in most brain regions including the hippocampus, cortex, and cerebellum and was similar to the results from RT-PCR analysis. C: Soluble tau levels in the brains of homozygous mTau mice were determined by Western analysis (MS06 antibody) at 3 months of age. Glyceraldehyde-3-phosphate dehydrogenase (GAPDH) was used as a loading control. D: Densitometric analysis showed that homozygous mTau mice had soluble tau levels approximately 3.5-fold over the endogenous tau level of NTg mice. Hemizygous mTau mice had soluble tau levels twofold greater than the endogenous tau level in NTg mice. E: Survival rate for all cohorts were calculated using Kaplan-Meier methods (P < 0.001 for overall log-rank test) with survival curves compared using pairwise multiple comparison procedures (Holm-Sidak method). Homozygous mTau mice had accelerated mortality (>50% death) up to 4 months of age, which was statistically significant compared with hemizygous and NTg littermates (P = 0.025 and P = 0.017, respectively).
Figure 4
Figure 4
Soluble hyperphosphorylated tau protein increases with age, and sarkosyl-insoluble tau is present in mTau mice. A and B: Western blots and optical density analysis of total tau protein levels and phosphorylation changes with age in Tg mTau mice at various ages and NTg littermates. Asterisk indicates a sick animal at time of harvest. Blots were probed with phospho-tau antibody (Ab) CP13, PHF1, and total tau antibodyTau5 normalized to glyceraldehyde-3-phosphate dehydrogenase and relative to average NTgs. Statistical analysis was done by Student’s t-test in Excel. Total tau protein expression and tau hyperphosphorylation appears to peak at 15 months of age in the mTau mice, with this age group showing a statistically significant difference between Tgs and NTgs for total tau expression (Tau5 antibody) (P = 0.016). This experiment was repeated five times with similar results (n = 2–3 per genotype per time point per gel); representative Western blots shown above. C: Western blot of sarkosyl-insoluble tau using PHF1 phospho-tau antibody. Western blots were repeated five times with similar results (n = 2–3 per genotype per time point per gel); representative Western blots shown above. D: Electron microscopy shows immunogold labeling, using Ab WSK44, of sarkosyl-insoluble tau aggregates in the 30 to 50% interface after sucrose gradient purification of the sarkosyl-insoluble fraction.
Figure 5
Figure 5
Tau burden increases with age and gene expression. Paraffin sections of the piriform cortex were immunostained with CP13. A: 3-month hemizygous. B: 6-month hemizygous. C: 9-month hemizygous. D: 3-month homozygous (images at ×40 magnification). E: 12-month hemizygous. F: 15-month hemizygous. G: 18-month hemizygous. H: 18-month NTg (images at ×10 magnification). Tau burden was determined using the positive pixel count algorithm of Aperio ImageScope software. Percent positivity in cortex (I) and hippocampus (J) of mTau mice is shown. Statistical analyses were performed (n = 5–9 for NTgs and 8–9 for Tgs) using the Spearman rank-order correlation test in SigmaPlot and showed positive correlations between age and tau burden in the cortex (correlation coefficient 0.263; P = 0.02) and hippocampus (correlation coefficients 0.492; P = 0.00) and between genotype and tau burden (correlation coefficient for cortex 0.548, P = 0.00; correlation coefficient for hippocampus 0.549, P = 0.00).
Figure 6
Figure 6
Neurodegenerative changes in mTau mice. A–C: Astrogliosis increases with age and tau gene expression in the mTau mice. Paraffin sections immunostained with GFAP show severe astrogliosis in the cortex of an 18-month Tg mTau mouse at ×5 (B) and ×20 (C) magnification. A: ×5 magnification of 18-month NTg for comparison. D–F: Vacuolization increases with age and tau burden in the mTau mice. Paraffin sections immunostained with H&E show vacuolization in the hippocampus of an 18-month Tg mTau mouse at ×5 (D) and ×20 (E) magnification. F: Vacuole burden in the hippocampus was determined by scoring 0 to 3 (Supplemental Figure 3, see http://ajp.amjpathol.org). All scoring was done blinded to genotype, age, and gender; n = 8–13 mTau mice per genotype per time point. Statistical analysis of burden scores and vacuole burden scores using the Spearman rank-order correlation test in SigmaPlot showed positive correlations between age and tau burden (correlation coefficient 0.357; P = 0.02), genotype and tau burden (correlation coefficient 0.783, P = 0.00), genotype and vacuole burden (correlation coefficient 0.325, P = 0.03), and tau burden and vacuole burden (correlation coefficient 0.316, P = 0.04). G–I: Electron micrographs of various stages of the vacuolization process occurring in the mTau mice. G: Electron micrograph showing an almost normal axon with layers of myelin tightly packed, although the innermost lamellae of the myelin sheath is starting to separate. H: Electron micrograph showing separation of the innermost lamellae of the myelin sheath due to axonal degeneration. Fluid infiltrates myelin sheath creating vacuolizations within an axon. Inset: Higher magnification image showing intramyelin vacuolization due to a split at the intraperiod line (red arrow) of myelin sheath of the axon. I: Electron micrograph showing a completely degenerated axon. Inset: Higher magnification image confirming that this was an axon as evidenced by the presence of the myelin sheath and filaments measuring the size of neurofilaments. J–L: Evidence of hippocampal neuronal loss in the mTau mice with aging. Paraffin sections of the dentate gyrus were immunostained with the neuron-specific nuclear protein, NeuN. J: 22-month NTg. K: 22-month Tg. All images are at ×10 magnification. L: Image analysis of NeuN staining in the hippocampus of mTau mice was performed using the positive pixel count algorithm of Aperio ImageScope software. Percent positivity in hippocampus of mTau mice is shown. Quantification of NeuN staining, which stains neurons, showed a nonsignificant trend toward neuronal loss in aged mTau mice compared with younger mTau and age-matched NTg animals. Statistical analysis was done by t-test in SigmaPlot using matched serial sections from Tg and NTg mTau mice (n = 3 to 4 NTg and 5 to 7 Tg mice per time point).

References

    1. Goedert M, Spillantini MG, Jakes R, Rutherford D, Crowther RA. Multiple isoforms of human microtubule-associated protein tau: sequences and localization in neurofibrillary tangles of Alzheimer’s disease. Neuron. 1989;3:519–526. - PubMed
    1. Andreadis A, Brown WM, Kosi KS. Structure and novel exons of the human tau gene. Biochemistry. 1992;31:10626–10633. - PubMed
    1. Hutton M, Lendon CL, Rizzu P, Baker M, Froelich S, Houlden H, Pickering-Brown S, Chakraverty S, Isaacs A, Grover A, Hackett J, Adamson J, Lincoln S, Dickson D, Davies P, Pertersen RC, Stevens M, de Graaff E, Wauters E, van Baren J, Hillebrand M, Joosse M, Kwon JM, Nowotny P, Che LK, Norton J, Morris JC, Reed LA, Trojanowski J, Basun H, Lannfelt L, Neystat M, Fahn S, Dark F, Tannenberg T, Dodd PR, Hayward N, Kwok JB, Schofield PR, Andreadis A, Snowden J, Craufurd D, Neary D, Owen F, Oostra BA, Hardy J, Goate A, van Swieten J, Mann D, Lynch T, Heutink P. Association of missense and 5′-splice-site mutations in tau with the inherited dementia FTDP-17. Nature. 1998;393:702–705. - PubMed
    1. Poorkaj P, Bird TD, Wijsman E, Nemens E, Garruto RM, Anderson L, Andreadis A, Wiederholt WC, Raskind M, Schellenberg GD. is a candidate gene for chromosome 17 frontotemporal dementia. Ann Neurol. 1998;43:815–825. - PubMed
    1. Eriksen JL, Zehr C, Lewis J. Biologic models of neurodegenerative disorders. Duyckaerts C, Litvan I, editors. New York,: Elsevier,; 2008:pp. 173–188. - PubMed

Publication types

MeSH terms