. 2009 Nov;297(5):H1820-8.
doi: 10.1152/ajpheart.00326.2009. Epub 2009 Aug 28.

Ca(v)1.2 splice variant with exon 9* is critical for regulation of cerebral artery diameter

Affiliations

Ca(v)1.2 splice variant with exon 9* is critical for regulation of cerebral artery diameter

Matthew A Nystoriak et al. Am J Physiol Heart Circ Physiol. 2009 Nov.

Abstract

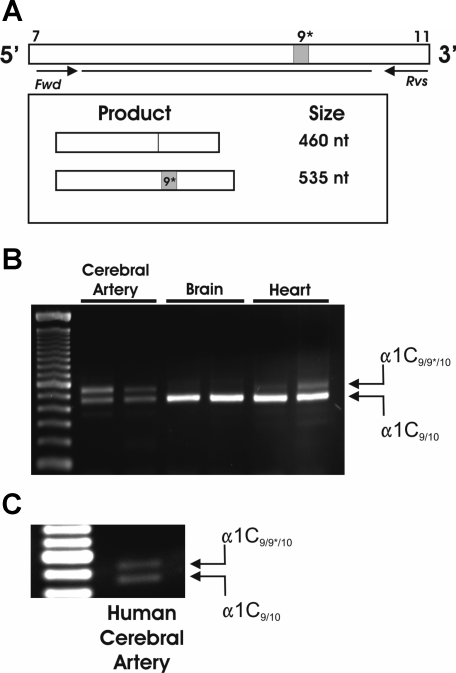
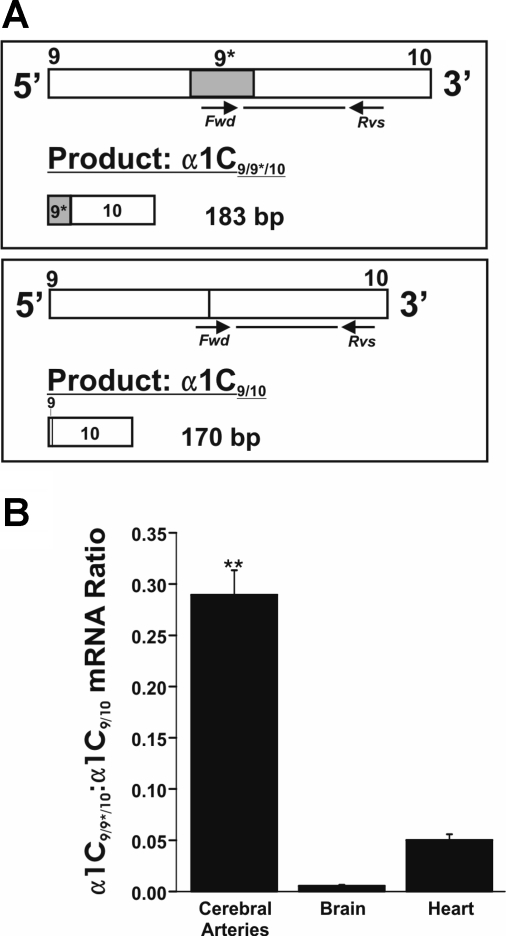
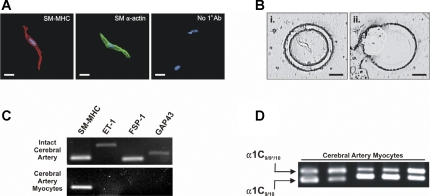
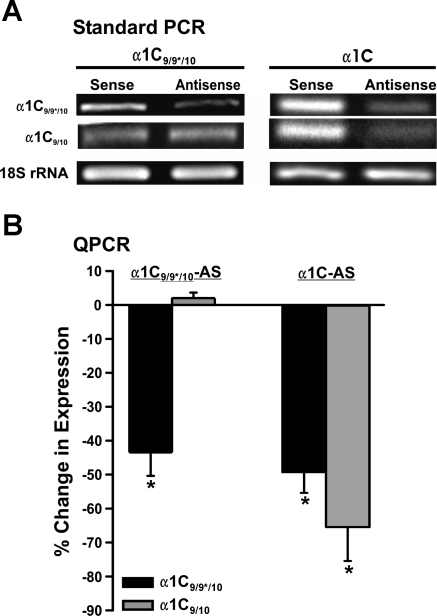
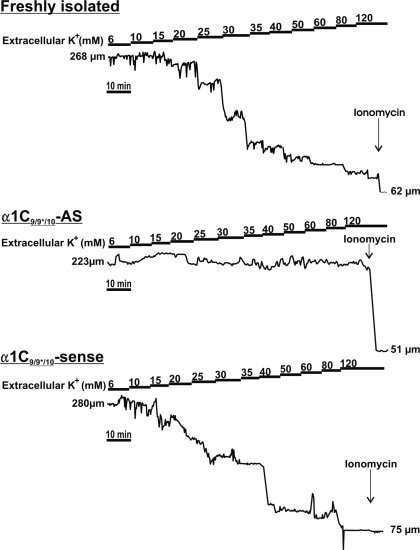
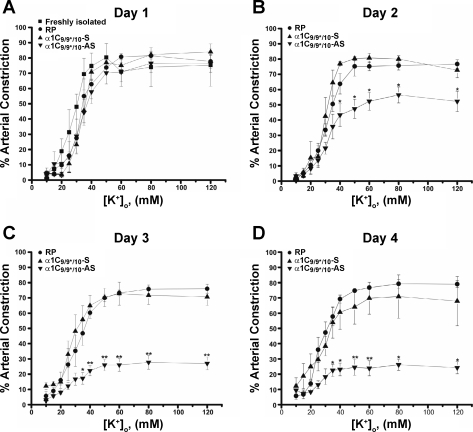
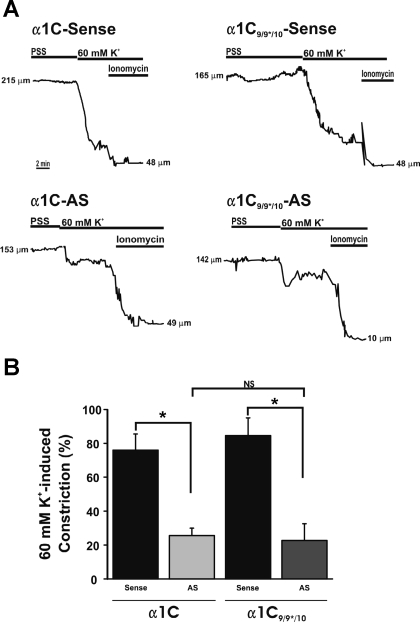
L-type voltage-dependent Ca(2+) channels (VDCCs) are essential for numerous processes in the cardiovascular and nervous systems. Alternative splicing modulates proteomic composition of Ca(v)1.2 to generate functional variation between channel isoforms. Here, we describe expression and function of Ca(v)1.2 channels containing alternatively spliced exon 9* in cerebral artery myocytes. RT-PCR showed expression of Ca(v)1.2 splice variants both containing (alpha(1)C(9/9*/10)) and lacking (alpha(1)C(9/10)) exon 9* in intact rabbit and human cerebral arteries. With the use of laser capture microdissection and RT-PCR, expression of mRNA for both alpha(1)C(9/9*/10) and alpha(1)C(9/10) was demonstrated in isolated cerebral artery myocytes. Quantitative real-time PCR revealed significantly greater alpha(1)C(9/9*/10) expression relative to alpha(1)C(9/10) in intact rabbit cerebral arteries compared with cardiac tissue and cerebral cortex. To demonstrate a functional role for alpha(1)C(9/9*/10), smooth muscle of intact cerebral arteries was treated with antisense oligonucleotides targeting alpha(1)C(9/9*/10) (alpha(1)C(9/9*/10)-AS) or exon 9 (alpha(1)C-AS), expressed in all Ca(v)1.2 splice variants, by reversible permeabilization and organ cultured for 1-4 days. Treatment with alpha(1)C(9/9*/10)-AS reduced maximal constriction induced by elevated extracellular K(+) ([K(+)](o)) by approximately 75% compared with alpha(1)C(9/9*/10-)sense-treated arteries. Maximal constriction in response to the Ca(2+) ionophore ionomycin and [K(+)](o) EC(50) values were not altered by antisense treatment. Decreases in maximal [K(+)](o)-induced constriction were similar between alpha(1)C(9/9*/10)-AS and alpha(1)C-AS groups (22.7 + or - 9% and 25.6 + or - 4% constriction, respectively). We conclude that although cerebral artery myocytes express both alpha(1)C(9/9*/10) and alpha(1)C(9/10) VDCC splice variants, alpha(1)C(9/9*/10) is functionally dominant in the control of cerebral artery diameter.


Figures

Fig. 1.
Fig. 1.
Cerebral arteries express α1C9/9*/10. A: PCR primer design for the detection of α1C9/9*/10 and α1C9/10. Amplification of transcripts containing exon 9* results in 535 nucleotide (nt) product, whereas amplification of transcripts excluding exon 9* results in 460 nt product. B: representative gel demonstrating 2 bands corresponding to both α1C9/9*/10 and α1C9/10 present in whole cerebral arteries (n = 7); α1C9/10 band is most prominent in brain (n = 5) and heart tissue (n = 8). C: resulting RT-PCR gel using cDNA obtained from whole cerebral arteries from human (n = 2) demonstrates presence of 2 bands corresponding to α1C9/9*/10 and α1C9/10. Fwd, forward; Rvs, reverse.
Fig. 2.
Fig. 2.
Quantitative real-time PCR (qPCR) shows high expression of α1C9/9*/10 in cerebral arteries. A: PCR primer sets for the specific detection of α1C9/9*/10 and α1C9/10. α1C9/9*/10-specific (left) forward primer recognizes sequence specific to exon 9*. α1C9/10 (right) forward primer recognizes sequence of boundary between exons 9 and 10. Sequence analysis of PCR products confirmed specificity of primers for target sequences. B: summary qPCR data for cerebral arteries, brain (cortex), and heart (left ventricle). The ratio of α1C9/9*/10 to α1C9/10 mRNA was significantly greater in cerebral arteries relative to brain and heart (0.289 ± 0.024; n = 7 compared with 0.006 ± 0.001; n = 4 and 0.050 ± 0.006; n = 8, respectively). **P < 0.01 vs. brain and heart.
Fig. 3.
Fig. 3.
Cerebral artery myocytes express both α1C9/9*/10 and α1C9/10 splice variants. A: immunostaining of isolated cerebral artery myocytes. Red: smooth muscle (SM) myosin heavy chain (SM-MHC); green: SM-α-actin (color changed from red to green to distinguish from SM-MHC); blue: 4,6-diamidino-2-phenylindole nuclear stain. Scale bars represent 10 μm. A lack of staining was observed for SM-MHC or SM-α-actin by cells incubated without primary antibody (No 1° Ab; right). B: microdissection of isolated cerebral artery myocytes. Live myocytes plated on PALM Duplex dish (Ziess) were identified by cell morphology and the surrounding dish membrane was cut. Myocytes were then catapulted onto PALM Adhesivecap collection tubes (Ziess) for mRNA extraction. Scale bars represent 25 μm. C: representative gel showing the presence of cell markers: SM-MHC (smooth muscle), endothelin-1 (ET-1; endothelium), fibroblast specific protein-1 (FSP-1; fibroblast), and growth associated protein-43 (GAP43; neuronal). All markers are amplified using cDNA from whole cerebral arteries. cDNA from cerebral artery myocytes samples collected by laser capture microdissection demonstrate amplification of SM-MHC, whereas other markers were not detected. D: results of nested PCR performed on cDNA from isolated cerebral artery myocytes. First round of amplification (35 cycles) was performed using primers for exons 7–11 of Cav1.2 (see Fig. 1A). Second round of amplification (35 cycles) was done using nested primers (see methods) and 1:100 dilution of first-round PCR products. Final products represent expression of α1C9/9*/10 (top band) and α1C9/10 (lower band; n = 5).
Fig. 4.
Fig. 4.
Selective suppression of Cav1.2 splice variants following antisense treatment and organ culture for 4 days. A: RT-PCR was performed on cDNA from arteries treated with α1C9/9*/10-antisense (AS), α1C-AS, and corresponding sense oligonucleotides. Band intensity corresponding to α1C9/9*/10 was reduced in α1C9/9*/10-AS-treated artery samples following 4 days in organ culture compared with sense-treated arteries (left; n = 4). Lower band, corresponding to α1C9/10, was similar between 2 groups. RT-PCR gel demonstrating reduction in both α1C9/9*/10 and α1C9/10 band intensity following treatment with α1C-AS and organ culture for 4 days (right; n = 4) is shown. Total RNA used was similar as shown by endogenous control 18S ribosomal RNA. B: quantification of changes in mRNA levels using qPCR in antisense-treated arteries compared with sense-treated arteries from same animal. *P < 0.05 (α1C9/9*/10-AS/S, n = 4; α1C-AS/S, n = 4).
Fig. 5.
Fig. 5.
Representative arterial diameter traces demonstrating important functional role for α1C9/9*/10 in arterial constriction. All arteries were cannulated, pressurized to 20 mmHg, and perfused with physiological saline solution (PSS) for 30 min before stepwise increases in extracellular K+ ([K+]o). Control freshly isolated and sense-treated (day 4) arteries responded to increases in [K+]o by graded constriction. α1C9/9*/10-AS-treated (day 4) arteries exhibited a marked reduction in [K+]o-induced constriction. Ionomycin (10 μM) was applied at the end of each experiment.
Fig. 6.
Fig. 6.
Time course for α1C9/9*/10-AS effect. A (day 1): α1C9/9*/10-AS, α1C9/9*/10-sense-treated (α1C9/9*/10-S), and RP arteries exhibit constriction similar to freshly isolated cerebral arteries (day 0). B–D (days 2–4): α1C9/9*/10-AS arteries exhibit significantly reduced arterial constriction in response to increased [K+]o with constrictions nearly abolished following 4 days in organ culture compared with α1C9/9*/10-sense and RP arteries organ cultured for the same period of time. No significant differences were observed in arterial constriction between α1C9/9*/10-sense-treated artery groups (days 1–4; n = 4 to 5) and freshly isolated arteries (day 0; n = 5). *P < 0.05; **P < 0.01.
Fig. 7.
Fig. 7.
α1C9/9*/10 plays a dominant role in cerebral artery constriction. A: representative diameter traces showing response to 60 mM [K+]o followed by application of 10 μM ionomycin. B: summary of 60 mM [K+]o for AS-treated arteries. All constrictions were normalized to minimum diameter obtained in ionomycin and maximum diameter obtained in Ca2+-free PSS with diltiazem (100 μM) and forskolin (1 μM). After 4 days in organ culture following oligonucleotide treatment, arteries treated with α1C-AS exhibited similar response to 60 mM [K+]o as arteries treated with α1C9/9*/10-AS. α1C9/9*/10-AS and α1C-AS groups were significantly decreased compared with corresponding sense-treated groups. No significant difference (NS) was observed between α1C9/9*/10-AS and α1C-AS groups (*P < 0.05; α1C9/9*/10-sense, n = 4; α1C9/9*/10-AS, n = 6; α1C-sense, n = 5; α1C-AS, n = 5).

References

    1. Barillot W, Treguer K, Faucheux C, Fedou S, Theze N, Thiebaud P. Induction and modulation of smooth muscle differentiation in Xenopus embryonic cells. Dev Dyn 237: 3373–3386, 2008 - PubMed
    1. Biel M, Ruth P, Bosse E, Hullin R, Stuhmer W, Flockerzi V, Hofmann F. Primary structure and functional expression of a high voltage activated calcium channel from rabbit lung. FEBS Lett 269: 409–412, 1990 - PubMed
    1. Bielefeldt K. Molecular diversity of voltage-sensitive calcium channels in smooth muscle cells. J Lab Clin Med 133: 469–477, 1999 - PubMed
    1. Braas KM, May V. Pituitary adenylate cyclase-activating polypeptides directly stimulate sympathetic neuron neuropeptide Y release through PAC (1) receptor isoform activation of specific intracellular signaling pathways. J Biol Chem 274: 27702–27710, 1999 - PubMed
    1. Catterall WA. Structure and regulation of voltage-gated Ca2+ channels. Annu Rev Cell Dev Biol 16: 521–555, 2000 - PubMed

Publication types

MeSH terms