. 2009 Sep;15(9):1046-54.
doi: 10.1038/nm.2010. Epub 2009 Aug 30.

Impaired Wnt-beta-catenin signaling disrupts adult renal homeostasis and leads to cystic kidney ciliopathy

Affiliations

Impaired Wnt-beta-catenin signaling disrupts adult renal homeostasis and leads to cystic kidney ciliopathy

Madeline A Lancaster et al. Nat Med. 2009 Sep.

Abstract

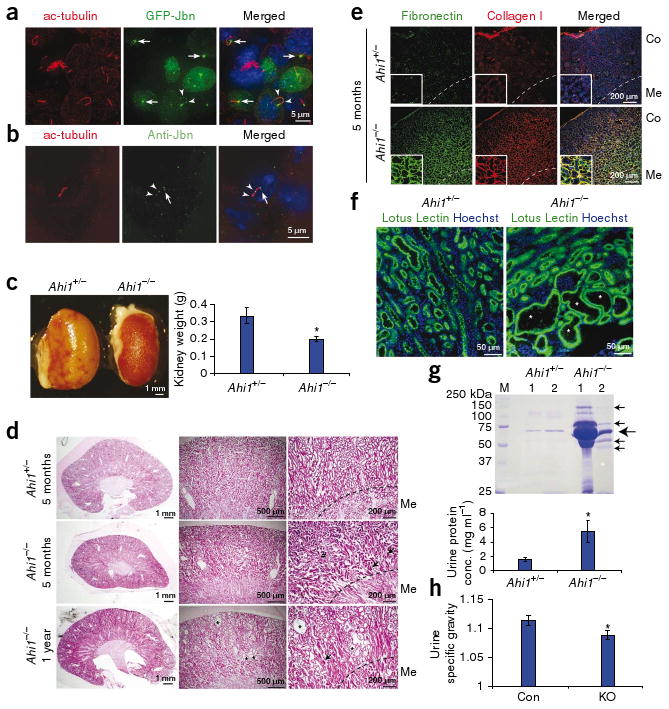
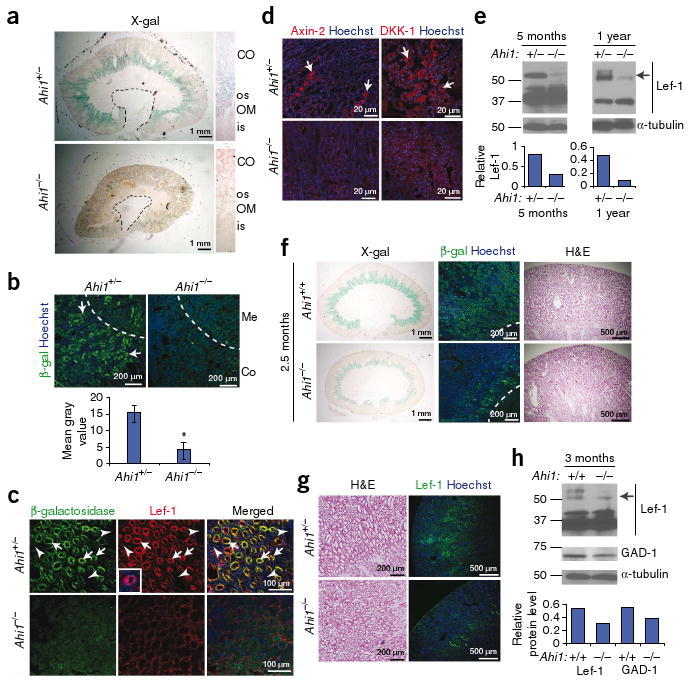
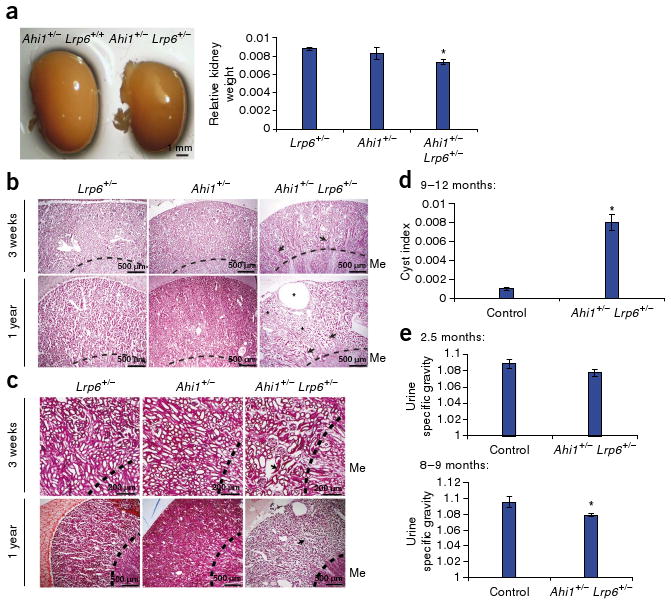
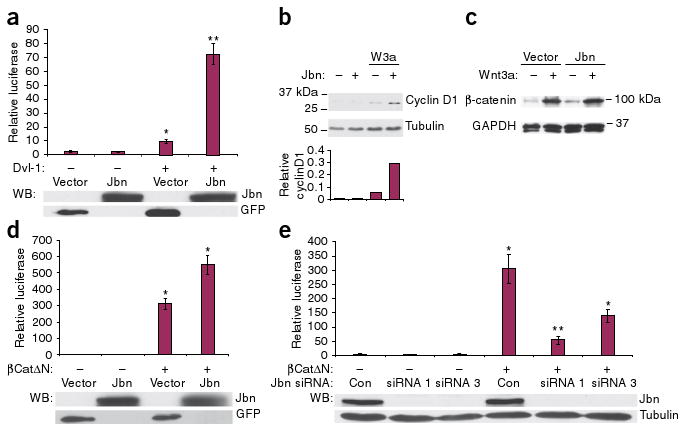
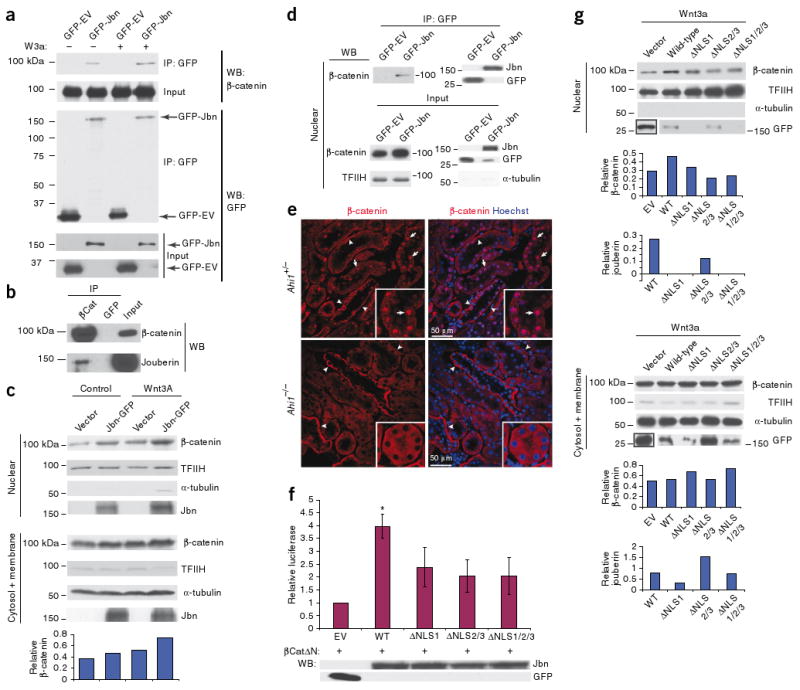
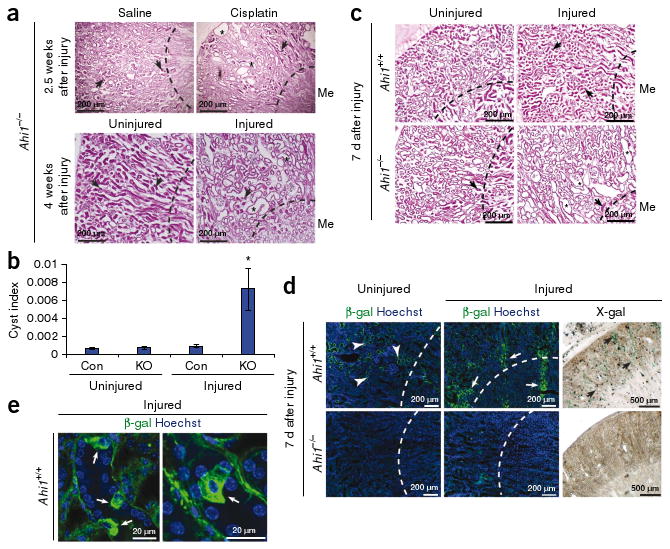
Cystic kidney disease represents a major cause of end-stage renal disease, yet the molecular mechanisms of pathogenesis remain largely unclear. Recent emphasis has been placed on a potential role for canonical Wnt signaling, but investigation of this pathway in adult renal homeostasis is lacking. Here we provide evidence of a previously unidentified canonical Wnt activity in adult mammalian kidney homeostasis, the loss of which leads to cystic kidney disease. Loss of the Jouberin (Jbn) protein in mouse leads to the cystic kidney disease nephronophthisis, owing to an unexpected decrease in endogenous Wnt activity. Jbn interacts with and facilitates beta-catenin nuclear accumulation, resulting in positive modulation of downstream transcription. Finally, we show that Jbn is required in vivo for a Wnt response to injury and renal tubule repair, the absence of which triggers cystogenesis.


Figures

Figure 1
Figure 1
Loss of Jbn leads to nephronophthisis pathology. (a) Mouse kidney inner medullary collecting duct cells transfected with GFP-Jbn (green) and stained for acetylated tubulin (ac-tubulin, red) to visualize cilia. Hoechst (blue) labels nuclei. (b) Endogenous Jbn-specific antibody staining (Anti-Jbn, green) in vivo in tubular epithelial cells of mouse kidney with acetylated tubulin costaining (red). Note basal body localization (arrows), and punctate axonemal staining (arrowheads). (c) Kidneys from Ahi1+/− and Ahi1−/− littermates (left) and average kidney weight measurement at 5 months of age (right) (Student's t test, *P < 0.05, n = 3). (d) H&E staining of 5-month-old Ahi1−/− kidney sections compared to littermate Ahi1+/− kidney sections. Tubular collapse (arrows) and mononuclear cell infiltrate (#) are indicated with tubule dilatation (*) at 1 year. Dashed line demarcates medullary (Me) boundary. (e) Antibody staining of 5-month-old littermate kidneys for fibronectin (green) and collagen I (red). Co, cortex. (f) Lotus lectin staining (green) in 1-year-old littermate kidneys revealing cysts (*) within proximal tubules of Ahi1−/− kidney. (g) Top, Coommassie-stained SDS-PAGE analysis of equal volumes of urine from two pairs of each 18-month-old littermates, one Ahi1+/− and one Ahi1−/−. The predicted size of albumin is shown (large arrow) as well as additional bands present in Ahi1−/− samples (small arrows). Bottom, histogram of average urine protein concentration (n = 5, *P < 0.05, Student's t-test). (h) Average urine specific gravity after 16 h of dehydration in control (Ahi1+/+ or Ahi1+/−, Con) or Ahi1 knockout (KO) littermates at 21 months of age (*P < 0.05, Student's t test, n = 5). Error bars are means ± s.e.m.
Figure 2
Figure 2
Jbn is required for Wnt activity in adult mouse kidney. (a) X-gal staining in 5-month-old littermate kidneys. Cross-section reveals outer stripe (os) staining. OM, outer medulla; CO, cortex; is, inner stripe. Dashed line, calyx boundary. (b) Top, antibody staining for β-galactosidase (green) in 5-month-old Ahi1+/− TOPGAL+ or Ahi1−/− TOPGAL+ kidneys. Hoechst labels nuclei (blue). Bottom, β-galactosidase average fluorescence. *P < 0.05, Student's t test, n = 3 images. Error bars represent means ± s.e.m. (c) β-galactosidase (green) and Lef-1 (red) protein staining (arrows) in Ahi1+/− TOPGAL+ and Ahi1−/− TOPGAL+ mice. Inset provides higher magnification of Lef-1 staining. Arrowheads indicate negative tubules for reference. (d) Axin-2 and DKK-1 staining (red, arrows) in the corticomedullary region of littermate kidneys. (e) Top, Lef-1 western blot from whole kidney lysates of littermates at 5 months and 1 year of age, revealing decreased expression of the full-length isoform (55–57 kDa, arrow). Bottom, full-length Lef-1 measurement relative to α-tubulin (loading control). (f) X-gal and β-galactosidase antibody staining in littermate kidneys at 2.5 months of age, before the onset of pathology (H&E at right). Dashed line demarcates the medullary boundary. (g) Lef-1 target gene staining (green) of Ahi1+/− and Ahi1−/− mice before nephronophthisis pathology (H&E at left). (h) Top, Lef-1 and GAD-1 western blots from whole-kidney lysates of Ahi1+/+ and Ahi1−/− littermates at 3 months of age. Bottom, full-length Lef-1 and GAD-1 levels relative to α-tubulin.
Figure 3
Figure 3
Ahi1 shows nonallelic noncomplementation with Lrp6. (a) Left, whole-mount image of Ahi1+/− kidney compared with Ahi1+/−;Lrp6+/− kidney. Right, the average kidney weight relative to total body weight (kidney/body weight ratio, arbitrary units). *P < 0.05, n = 3, Students's t test. (b,c) H&E (b) and Masson's trichrome (c) staining in Lrp6 and Ahi1 single heterozygotes compared with double heterozygotes. Arrows point to collapsed dysmorphic tubules within the cortex at 3 weeks, with a worsening of the phenotype at 1 year, at which a large cyst as well as tubule dilatation (*) are evident. (d) Average of cyst index measurements from three sections of each kidney of single-heterozygote control littermates (Ahi1+/− or Lrp6+/−) and double-heterozygote mutants (Ahi1+/−;Lrp6+/−) at 9–12 months of age (Student's t test, *P < 0.05, n = 3). (e) Average urine specific gravity at 2.5 months (top) and 8–9 months (bottom) of age. Both ages show decreased levels in Ahi1+/−;Lrp6+/− mutants compared to single-heterozygote littermates (Ahi1+/− or Lrp6+/−) with significance at 8–9 months (*P < 0.05, Student's t test, n = 3). Error bars in all histograms represent means ± s.e.m.
Figure 4
Figure 4
Jbn is a positive modulator of Wnt signaling downstream of β-catenin stabilization. (a) Top, induction of TCF/Lef by sevenfold by cotransfection of Jbn. *P < 0.001, **P < 5 × 10⁻⁷, n = 10 from four experiments, Student's t test. Values are relative to control untreated condition and are normalized for co-transfected β-gal. Western blot (WB) for construct expression from a representative luciferase is shown below each histogram. (b) Top, western blot for cyclin D1 with Wnt3a-conditioned medium treatment (W3a) and overexpression of Jbn. Bottom, quantification of cyclin D1 relative to α-tubulin (loading control). (c) Western blot of cytosolic extracts from 293T cells treated with Wnt3a-conditioned medium and expressing Jbn or empty vector. Glyceraldehyde-3-phosphate dehydrogenase (GAPDH) is the loading control. (d) Luciferase activity relative to vector transfected alone in 293T cells transfected with βCatΔN and Jbn or GFP empty vector. *P < 0.0005, Student's t test, n = 24 from nine experiments. (e) Luciferase reporter activity in N2A cells transfected with Jbn-specific siRNA (Jbn siRNA) constructs and βCatΔN. *P < 0.05, **P < 0.001 Student's t test, n = 7 from four experiments. Values normalized for total protein concentration are expressed as relative to control untreated condition. Error bars in all experiments represent means ± s.e.m.
Figure 5
Figure 5
Jbn facilitates β-catenin nuclear accumulation. (a) Western blot for β-catenin after GFP-Jbn immunoprecipitation (IP) compared with vector control (GFP-EV) with and without Wnt3a treatment (W3a). Input is total cell lysate before IP. (b) IP for endogenous β-catenin from postnatal day 5 mouse whole-brain lysates, with western blotting for endogenous Jbn. (c) Western blot analysis of nuclear extraction from cells transfected with Jbn or vector, with or without Wnt3A treatment. Transcription factor II H (TFIIH) and tubulin are nuclear and cytosolic fractionation controls. Quantification of two repeats of this experiment is shown at the bottom β-catenin relative to TFIIH and controlling for cytosolic contamination by subtraction of tubulin). (d) IP from Cos-7 nuclear extracts for GFP-Jbn with GFP-specific antibody and western blotting for endogenous nuclear β-catenin. Input is nuclear lysate before the addition of GFP antibody. (e) β-catenin staining (red) of 1-year-old littermate kidneys revealing nuclear (Hoechst, blue) localization of β-catenin (arrows) that is absent in Ahi1-null kidney. Arrowheads denote basolateral localization. (f) Luciferase activity in 293T cells transfected with βCatΔN and NLS mutants compared to wild-type Jbn. *P < 0.05, n = 4 from four separate experiments, Student's t test. Values are relative to vector control and normalized for co-transfected β-galactosidase. Error bars represent means ± s.e.m. Western blot is from a representative luciferase assay. (g) Nuclear extraction and β-catenin western blotting from Cos-7 cells with overexpression of wild-type Jbn or NLS mutants. TFIIH and α-tubulin are controls for the nuclear extraction. Jbn and β-catenin levels are quantified relative to TFIIH levels for nuclear fraction or α-tubulin for cytosolic fraction.
Figure 6
Figure 6
Ahi1−/− mice show defective recovery from renal injury. (a) H&E histology in 4-month-old injured Ahi1−/− kidneys (cisplatin administration or renal IRI (Injured) on the left kidney) compared with saline-treated or uninjured kidneys. Arrows indicate early signs of nephronophthisis, although cysts are not present. Asterisks depict cysts and tubule dilatation 2.5 weeks after cisplatin injection or 4 weeks after IRI of the left kidney (*). Dashed line indicates medullary boundary. (b) Average cyst index measurement from littermate control (Con) and Ahi1−/− (KO) uninjured and injured kidneys at 2.5–4 weeks after injury with either cisplatin or IRI (n = 3 kidneys each, *P < 0.05, Student's t test). (c) H&E histology of injured left kidney of littermate wild-type mice 7 d after IRI showing tubular obstruction and collapse (arrows). Ahi1−/− injured kidney instead shows tubular dilatation and microcysts (*) with evident glomerulosclerosis. Dashed line indicates medullary boundary. n = 3 mutant mice and n = 4 control mice. (d) β-galactosidase–specific antibody (green) and X-gal staining in control littermate uninjured right kidney and injured left kidney. Hoechst (blue) labels nuclei, and the dashed line indicates the medullary boundary. (e) Higher magnification of β-galactosidase–positive kidney tubules in control injured sections, revealing Wnt-responsive cells with fibroblast-like morphology.

References

    1. Harris PC. Molecular basis of polycystic kidney disease: PKD1, PKD2 and PKHD1. Curr Opin Nephrol Hypertens. 2002;11:309–314. - PubMed
    1. Hildebrandt F, Zhou W. Nephronophthisis-associated ciliopathies. J Am Soc Nephrol. 2007;18:1855–1871. - PubMed
    1. Simons M, et al. Inversin, the gene product mutated in nephronophthisis type II, functions as a molecular switch between Wnt signaling pathways. Nat Genet. 2005;37:537–543. - PMC - PubMed
    1. Bergmann C, et al. Loss of nephrocystin-3 function can cause embryonic lethality, Meckel-Gruber–like syndrome, situs inversus, and renal-hepatic-pancreatic dysplasia. Am J Hum Genet. 2008;82:959–970. - PMC - PubMed
    1. Saadi-Kheddouci S, et al. Early development of polycystic kidney disease in transgenic mice expressing an activated mutant of the β-catenin gene. Oncogene. 2001;20:5972–5981. - PubMed

Publication types