

doi: 10.1038/nchembio.212.
Epub 2009 Aug 30.
Extracellular redox modulation by regulatory T cells
Affiliations
- PMID: 19718041
- PMCID: PMC2760945
- DOI: 10.1038/nchembio.212
Item in Clipboard
Extracellular redox modulation by regulatory T cells
Nat Chem Biol.
2009 Oct.
Abstract
We demonstrate that the mechanism of redox remodeling during mouse T-cell activation involves secretion of glutathione by dendritic cells and its subsequent cleavage to cysteine. Extracellular cysteine accumulation results in a lower redox potential, which is conducive to proliferation, and changes the net redox status of exofacial protein domains. Regulatory T cells inhibit this redox metabolite signaling pathway, which represents a previously unrecognized mechanism for immunosuppression of effector T cells.
Figures
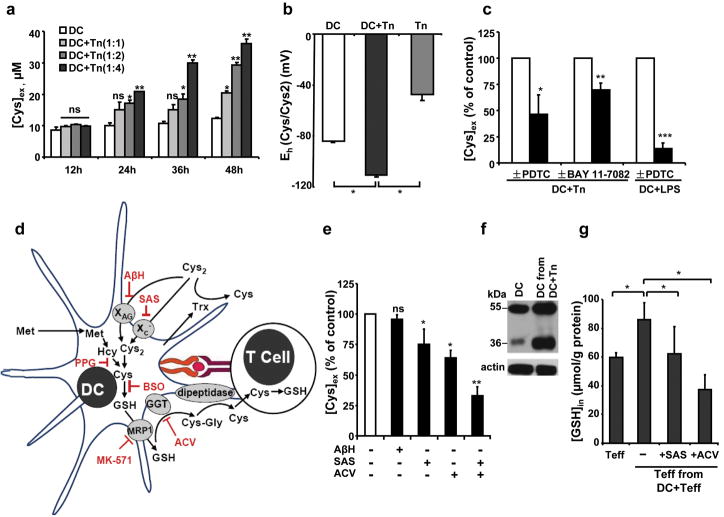
(a) DCs were co-cultured with Tn cells at a 1:1, 1:2 or 1:4 ratio for different durations, and the [Cys]ex was measured. (b) Changes in the extracellular Cys/cystine redox potential at 36 h. The extracellular Cys/cystine redox potential was calculated according to the Nernst equation: Eh = Eo + RT/2ℱ ln ([cystine]/[Cys]2), using Eo=−250 mV (pH=7.4). (c) Effect of NF-κB pathway inhibitors on [Cys]ex. (d) Cys metabolism during DC-T cell interaction and the effects of inhibitors. Propargylglycine (PPG), butathionine sulfoximine (BSO), sulfasalzine (SAS), L-aspartic acid β-hydroxamate (AβH), acivicin (ACV) and MK-571 inhibit γ-cystathionase, γ-glutamylcysteinyl synthetase, the xC− and the XAG transporter, γ-glutamyltranspeptidase, and the multidrug resistance protein 1 (MRP1) respectively. (e) Inhibition of [Cys]ex by various inhibitors. DCs were co-cultured for 36 h with Tn cells (1:4) ± 400 μM AβH, or ± 500 μM SAS, or ± 250 μM ACV or ± SAS+ACV. [Cys]ex is expressed as a percent of the concentration in untreated DC-T cell co-culture medium. The data represent the mean ± SD of at least 4 experiments with different batches of cells. (f) xCT expression in DCs cultured ± Tn cells for 36 h. xCT migrates as 35 and 55 kDa bands. (g) [GSH]in in Teffs cells co-cultured with DCs (1:4) for 16 h ± SAS or ACV. Representative data from one of three independent experiments are shown for a, b, c, f, g. (*, p<0.05; **, p<0.005; ***, p<0.0005; two tailed Student’s t-test).

(a) [Cys]ex during co-culture of DCs with Tn cells (1:4) or with Tn+Treg cells (1:4:1 or 1:4:2). (b) [Cys]ex in DC+LPS±Treg (1:2). (c) Treg-mediated suppression of [GSH]in in Teffs measured by labeling with chloromethylfluorescein diacetate (CMFDA) and (d) quantitative analysis. Student’s t-test revealed a significant reduction in DC+T cell- and DC+LPS-induced [Cys]ex (panels a, b, n=4) and GSHin labeling in T cells (panel d, n=2) in the presence of Treg cells. (e) Teff proliferation ± Tregs and with the addition of Cys to the medium as measured by the [3H]-thymidine incorporation assay. Student’s t-test revealed significant inhibition of proliferation of Teffs by Tregs, which was abrogated by addition of exogenous Cys (n=3). (f) Cell surface thiol levels on DCs and T cells as a function of co-culture using Alexa-maleimide 488 (ALM-488) staining followed by FACS analysis. (g) Quantification of the mean fluorescence intensity (MFI) data shown in panel f (n=4). (h) Confocal microscopy using Alexa-maleimide 594 staining shows an increase in cell surface thiol levels on DCs and T cells as a function of co-culture as compared to single culture. (i) Tregs suppress surface thiol levels on DCs, T cells and LPS-activated DCs. (j) Quantitative analysis of FACS data shown in panel i (n =3). Data represent the mean ± SD of independent experiments (n as indicated in each section). (*, p<0.05; **, p<0.005; two tailed Student’s t-test).
Comment in
-
Chemo-metabolic regulation of immune responses by Tregs.Nat Chem Biol. 2009 Oct;5(10):709-10. doi: 10.1038/nchembio.226. Nat Chem Biol. 2009. PMID: 19763100 No abstract available.
References
Publication types
MeSH terms
Substances
Associated data
- PubChem-Substance/85147453
- PubChem-Substance/85147454
- PubChem-Substance/85147455
- PubChem-Substance/85147456
- PubChem-Substance/85147457
- PubChem-Substance/85147458
- PubChem-Substance/85147459
- PubChem-Substance/85147460
- PubChem-Substance/85147461
- PubChem-Substance/85147462
- PubChem-Substance/85147463
- PubChem-Substance/85147464
Grants and funding
LinkOut - more resources
Full Text Sources
