. 2009 Aug 31;4(8):e6852.
doi: 10.1371/journal.pone.0006852.

Early epidemiological assessment of the virulence of emerging infectious diseases: a case study of an influenza pandemic

Affiliations

Early epidemiological assessment of the virulence of emerging infectious diseases: a case study of an influenza pandemic

Hiroshi Nishiura et al. PLoS One. .

Abstract

Background: The case fatality ratio (CFR), the ratio of deaths from an infectious disease to the number of cases, provides an assessment of virulence. Calculation of the ratio of the cumulative number of deaths to cases during the course of an epidemic tends to result in a biased CFR. The present study develops a simple method to obtain an unbiased estimate of confirmed CFR (cCFR), using only the confirmed cases as the denominator, at an early stage of epidemic, even when there have been only a few deaths.

Methodology/principal findings: Our method adjusts the biased cCFR by a factor of underestimation which is informed by the time from symptom onset to death. We first examine the approach by analyzing an outbreak of severe acute respiratory syndrome in Hong Kong (2003) with known unbiased cCFR estimate, and then investigate published epidemiological datasets of novel swine-origin influenza A (H1N1) virus infection in the USA and Canada (2009). Because observation of a few deaths alone does not permit estimating the distribution of the time from onset to death, the uncertainty is addressed by means of sensitivity analysis. The maximum likelihood estimate of the unbiased cCFR for influenza may lie in the range of 0.16-4.48% within the assumed parameter space for a factor of underestimation. The estimates for influenza suggest that the virulence is comparable to the early estimate in Mexico. Even when there have been no deaths, our model permits estimating a conservative upper bound of the cCFR.

Conclusions: Although one has to keep in mind that the cCFR for an entire population is vulnerable to its variations among sub-populations and underdiagnosis, our method is useful for assessing virulence at the early stage of an epidemic and for informing policy makers and the public.


Conflict of interest statement

Competing Interests: The authors have declared that no competing interests exist.

Figures

Figure 1
Figure 1. The population and sampling process for estimating the unbiased confirmed case fatality ratio during the course of an outbreak.
At time t we know the cumulative number of confirmed cases and deaths, C t and D t, and wish to estimate the unbiased case fatality ratio π, by way of the factor of underestimation u t. If we knew u t we could specify the size of the population no longer at risk (u t C t, shaded), although we do not know which surviving individuals belong to this group. A proportion π of those in the group still at risk (size (1- u t)C t, unshaded) is expected to die. Because each case no longer at risk had an independent probability of dying, π, the number of deaths, D t, is a sample from a binomial distribution with n = u t C t, and p t = π.
Figure 2
Figure 2. Temporal distribution of the date of onset for an H1N1 influenza epidemic in the USA and Canada, 2009.
Epidemic curves of confirmed cases of human infection with swine-origin influenza A (H1N1) virus (S-OIV) with known date of onset in (A) the USA (n = 394) and (B) Canada (n = 2004). The vertical dashed line is the date on which the Centers for Disease Control and Prevention identified S-OIV. The World Health Organization increased the pandemic alert level from 3 to 4 on April 27 (black arrow) and then to 5 on April 29 (gray arrow). It should be noted that confirmed cases include substantial numbers of imported cases from abroad. In Canada, a few cases whose dates of onset were unable to be traced are also included according to their dates when a specimen was collected (the exact number of such cases is not known). Assuming that their impact on our estimation procedure is negligibly small, we regard all cases in B as representing the dates of onset.
Figure 3
Figure 3. Early determination of the unbiased confirmed case fatality ratio of severe acute respiratory syndrome (SARS) in Hong Kong, 2003.
(A & B) Cumulative numbers of confirmed cases and deaths. The increase in death is delayed in observation because of the time delay from onset to death. (C) Observed biased confirmed case fatality ratio (cCFR) estimates as a function of time (thick line) calculated as the ratio of the cumulative number of confirmed cases to deaths at time t. The estimate at the end of an outbreak (i.e. 302/1755 = 17.2 %) is the realized cCFR by the end of the epidemic. The horizontal continuous line and dotted lines show the expected value and the 95% confidence intervals of the predicted unbiased cCFR estimate (based on our method) only by using the observed data until 27 Mar 2003 (estimated at 18.1 % (95% CI: 10.5, 28.1). The 95% confidence interval was derived from profile likelihood. (D) The comparisons between the realized cCFR (horizontal grey line), the unbiased cCFRs based on observations by calendar time t, and the biased cCFR estimates, b t, given by the ratio of deaths to cases. Each prediction was obtained by using the exponential growth rate r up to time t and the cumulative numbers of deaths and cases at time t, and the mean time from onset-to-death of 35.9 days which is assumed to follow an exponential distribution. Overestimation is seen in the early stages of the epidemic, but the 95% confidence limits in the later stages include the realized cCFR.
Figure 4
Figure 4. Sensitivity of the unbiased confirmed case fatality ratio of an influenza virus (H1N1) infection to different means and coefficients of variation of the time from onset to death in the USA and Canada, 2009.
The contours show the maximum likelihood estimate of the unbiased confirmed case fatality ratio as a function of the mean and coefficient of variation of the time from onset-to-death in (A) the USA and (B) Canada. The estimates are based on observation by May 1 and June 10, respectively, with 2 and 4 deaths among a total of 399 and 2978 confirmed cases, respectively. A gamma distribution is employed for the time from onset to death, f(s). Both the quantitative and qualitative patterns of the USA differ from those of Canada, because the epidemic curve in the USA include more cases who developed the disease recently than those in Canada. It should be noted that the contour gray scales are different in (A) and (B).
Figure 5
Figure 5. Upper bound of the confirmed case fatality ratio when there is no report of death.
Upper bound of the cCFR (confirmed case fatality ratio) estimates in (A) the USA and (B) Canada, given no deaths by April 21 and April 24, 2009, respectively (based on 42 and 91 cases). The upper bounds are examined for significance levels at 95% and 99% to find at least 1 death. Gamma and exponential distributions were employed to model the distribution of time from onset to death.
Figure 6
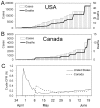
Figure 6. Time variations in the biased confirmed case fatality ratio of an H1N1 influenza epidemic in the USA and Canada, 2009.
Cumulative numbers of confirmed cases and deaths in (A) the USA and (B) Canada. Cases (bars) and deaths (thick lines) are comparatively shown. (C) The biased estimates of confirmed case fatality ratio (cCFR) given by the ratio of deaths per confirmed cases. The data were extracted from irregular situation updates of the World Health Organization , and the horizontal axis (time) corresponds to the date of reporting. Therefore, it should be noted that the estimate suffers reporting delay, and in this sense, the calculated biased cCFR is different from our b t (based on date of onset) in the main text. The most recent report was made on June 19. Since the interval of update has been irregular, the cumulative number of cases and deaths is kept the same as the latest report when there was no update on the corresponding date.

References

    1. Fraser C, Donnelly CA, Cauchemez S, Hanage WP, Van Kerkhove MD, et al. Pandemic Potential of a Strain of Influenza A (H1N1): Early Findings. Science. 2009;324:1557–1561. - PMC - PubMed
    1. Butler D. How severe will the flu outbreak be? Nature. 2009;459:14–15. - PMC - PubMed
    1. Butler D. Swine flu goes global. Nature. 2009;458:1082–1083. - PubMed
    1. Diekmann O, Heesterbeek JAP. New York: Wiley; 2000. Mathematical Epidemiology of Infectious Diseases: Model Building, Analysis and Interpretation.
    1. Nishiura H, Castillo-Chavez C, Safan M, Chowell G. Transmission potential of the new influenza A(H1N1) virus and its age-specificity in Japan. Euro Surveill. 2009;14:pii = 19227. - PubMed

Publication types

MeSH terms