

Single valproic acid treatment inhibits glycogen and RNA ribose turnover while disrupting glucose-derived cholesterol synthesis in liver as revealed by the [U-C(6)]-d-glucose tracer in mice
- PMID: 19718458
- PMCID: PMC2731156
- DOI: 10.1007/s11306-009-0159-1
Single valproic acid treatment inhibits glycogen and RNA ribose turnover while disrupting glucose-derived cholesterol synthesis in liver as revealed by the [U-C(6)]-d-glucose tracer in mice
Abstract
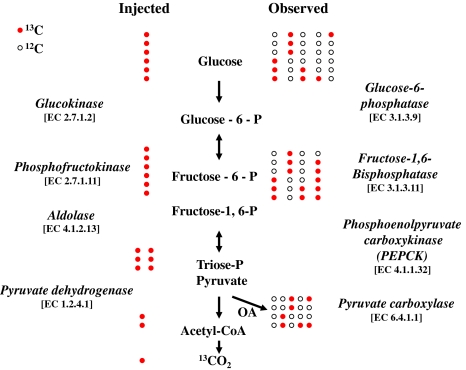
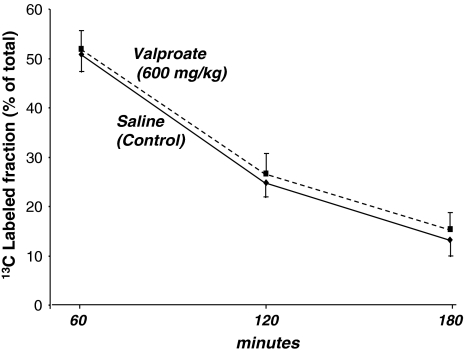
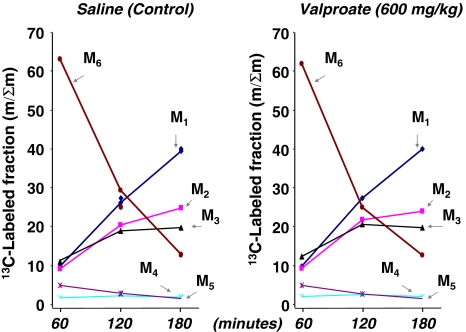
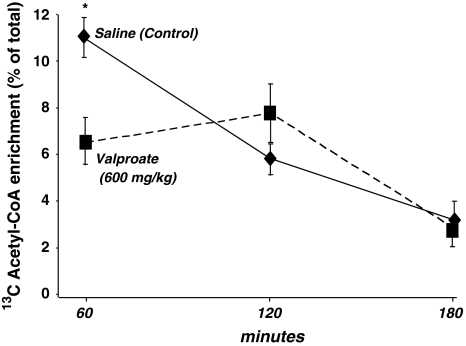
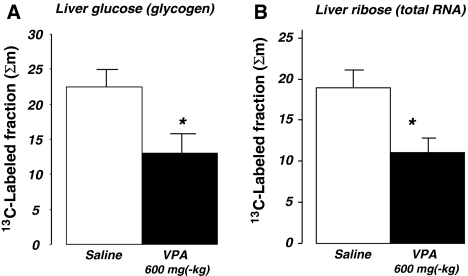
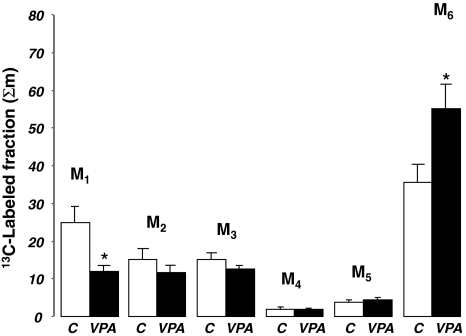
Previous genetic and proteomic studies identified altered activity of various enzymes such as those of fatty acid metabolism and glycogen synthesis after a single toxic dose of valproic acid (VPA) in rats. In this study, we demonstrate the effect of VPA on metabolite synthesis flux rates and the possible use of abnormal (13)C labeled glucose-derived metabolites in plasma or urine as early markers of toxicity. Female CD-1 mice were injected subcutaneously with saline or 600 mg/kg) VPA. Twelve hours later, the mice were injected with an intraperitoneal load of 1 g/kg [U-(13)C]-d-glucose. (13)C isotopomers of glycogen glucose and RNA ribose in liver, kidney and brain tissue, as well as glucose disposal via cholesterol and glucose in the plasma and urine were determined. The levels of all of the positional (13)C isotopomers of glucose were similar in plasma, suggesting that a single VPA dose does not disturb glucose absorption, uptake or hepatic glucose metabolism. Three-hour urine samples showed an increase in the injected tracer indicating a decreased glucose re-absorption via kidney tubules. (13)C labeled glucose deposited as liver glycogen or as ribose of RNA were decreased by VPA treatment; incorporation of (13)C via acetyl-CoA into plasma cholesterol was significantly lower at 60 min. The severe decreases in glucose-derived carbon flux into plasma and kidney-bound cholesterol, liver glycogen and RNA ribose synthesis, as well as decreased glucose re-absorption and an increased disposal via urine all serve as early flux markers of VPA-induced adverse metabolic effects in the host.
Figures
References
-
- {'text': '', 'ref_index': 1, 'ids': [{'type': 'DOI', 'value': '10.2337/diabetes.47.8.1302', 'is_inner': False, 'url': 'https://doi.org/10.2337/diabetes.47.8.1302'}, {'type': 'PubMed', 'value': '9703332', 'is_inner': True, 'url': 'https://pubmed.ncbi.nlm.nih.gov/9703332/'}]}
- Buchanan, T. A., Xiang, A., Kjos, S. L., et al. (1998). Gestational diabetes: Antepartum characteristics that predict postpartum glucose intolerance and type 2 diabetes in Latino women. Diabetes,47, 1302–1310. doi:10.2337/diabetes.47.8.1302. - PubMed
-
- {'text': '', 'ref_index': 1, 'ids': [{'type': 'PMC', 'value': 'PMC1309254', 'is_inner': False, 'url': 'https://pmc.ncbi.nlm.nih.gov/articles/PMC1309254/'}, {'type': 'PubMed', 'value': '1255526', 'is_inner': True, 'url': 'https://pubmed.ncbi.nlm.nih.gov/1255526/'}]}
- Cohen, J. J., & Little, J. R. (1976). Lactate metabolism in the isolated perfused rat kidney: Relations to renal function and gluconeogenesis. The Journal of Physiology,255, 399–414. - PMC - PubMed
-
- {'text': '', 'ref_index': 1, 'ids': [{'type': 'PubMed', 'value': '8150420', 'is_inner': True, 'url': 'https://pubmed.ncbi.nlm.nih.gov/8150420/'}]}
- Comi, R. J., & Hamilton, H. (1994). Reduction of red cell glucose transporter intrinsic activity in diabetes running. Hormone and Metabolic Research. Hormon- und Stoffwechselforschung. Hormones et Metabolisme,26, 26–32. doi:10.1055/s-2007-1000767. - PubMed
-
- {'text': '', 'ref_index': 1, 'ids': [{'type': 'PubMed', 'value': '3085437', 'is_inner': True, 'url': 'https://pubmed.ncbi.nlm.nih.gov/3085437/'}]}
- Cornford, E. M., & Oldendorf, W. H. (1986). Epilepsy and the blood-brain barrier. Advances in Neurology,44, 787–812. - PubMed
-
- {'text': '', 'ref_index': 1, 'ids': [{'type': 'DOI', 'value': '10.1007/BF02536448', 'is_inner': False, 'url': 'https://doi.org/10.1007/bf02536448'}, {'type': 'PubMed', 'value': '3330172', 'is_inner': True, 'url': 'https://pubmed.ncbi.nlm.nih.gov/3330172/'}]}
- Crick, D. C., & Carroll, K. K. (1987). Extraction and quantitation of total cholesterol, dolichol and dolichyl phosphate from mammalian liver. Lipids,22, 1045–1048. doi:10.1007/BF02536448. - PubMed