Functional in vivo optical imaging of tumor angiogenesis, growth, and metastasis prevented by administration of anti-human VEGF antibody in xenograft model of human fibrosarcoma HT1080 cells
- PMID: 19719773
- PMCID: PMC11158413
- DOI: 10.1111/j.1349-7006.2009.01305.x
Functional in vivo optical imaging of tumor angiogenesis, growth, and metastasis prevented by administration of anti-human VEGF antibody in xenograft model of human fibrosarcoma HT1080 cells
Abstract
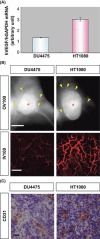
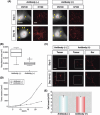
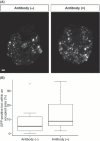
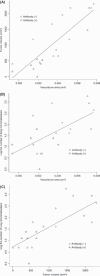
Angiogenesis plays a crucial role in cancer progression and metastasis. Thus, blocking tumor angiogenesis is potentially a universal approach to prevent tumor establishment and metastasis. In this study, we used in vivo and ex vivo fluorescence imaging to show that an antihuman vascular endothelial growth factor (VEGF) antibody represses angiogenesis and the growth of primary tumors of human fibrosarcoma HT1080 cells in implanted nude mice. Interestingly, administering the antihuman VEGF antibody reduced the development of new blood vessels and normalized pre-existing tumor vasculature in HT1080 cell tumors. In addition, antihuman VEGF antibody treatment decreased lung metastasis from the primary tumor, whereas it failed to block lung metastasis in a lung colonization experiment in which tumor cells were injected into the tail vein. These results suggest that VEGF produced by primary HT1080 cell tumors has a crucial effect on lung metastasis. The present study indicates that the in vivo fluorescent microscopy system will be useful to investigate the biology of angiogenesis and test the effectiveness of angiogenesis inhibitors.
Figures


Similar articles
-
Vascular endothelial growth factor-induced tumor angiogenesis and tumorigenicity in relation to metastasis in a HT1080 human fibrosarcoma cell model.Int J Cancer. 1999 Mar 1;80(5):738-43. doi: 10.1002/(sici)1097-0215(19990301)80:5<738::aid-ijc18>3.0.co;2-7. Int J Cancer. 1999. PMID: 10048976
-
Combined application of anti-VEGF and anti-EGFR attenuates the growth and angiogenesis of colorectal cancer mainly through suppressing AKT and ERK signaling in mice model.BMC Cancer. 2016 Oct 12;16(1):791. doi: 10.1186/s12885-016-2834-8. BMC Cancer. 2016. PMID: 27729020 Free PMC article.
-
Inhibition of tumor growth and metastasis by an immunoneutralizing monoclonal antibody to human vascular endothelial growth factor/vascular permeability factor121.Cancer Res. 1995 Nov 15;55(22):5296-301. Cancer Res. 1995. PMID: 7585591
-
Vascular endothelial cell growth factor (VEGF), an emerging target for cancer chemotherapy.Curr Med Chem Anticancer Agents. 2003 Mar;3(2):95-117. doi: 10.2174/1568011033353452. Curr Med Chem Anticancer Agents. 2003. PMID: 12678905 Review.
-
Inhibition of tumor growth and metastasis by targeting tumor-associated angiogenesis with antagonists to the receptors of vascular endothelial growth factor.Invest New Drugs. 1999;17(3):195-212. doi: 10.1023/a:1006314501634. Invest New Drugs. 1999. PMID: 10665474 Review.
Cited by
-
Syndecan-1 enhances proliferation, migration and metastasis of HT-1080 cells in cooperation with syndecan-2.PLoS One. 2012;7(6):e39474. doi: 10.1371/journal.pone.0039474. Epub 2012 Jun 26. PLoS One. 2012. PMID: 22745764 Free PMC article.
-
Association between SDF1-3'A or CXCR4 gene polymorphisms with predisposition to and clinicopathological characteristics of prostate cancer with or without metastases.Mol Biol Rep. 2012 Dec;39(12):11073-9. doi: 10.1007/s11033-012-2010-4. Epub 2012 Oct 11. Mol Biol Rep. 2012. PMID: 23053994
-
In vivo optical imaging of cancer cell function and tumor microenvironment.Cancer Sci. 2018 Apr;109(4):912-918. doi: 10.1111/cas.13544. Epub 2018 Mar 31. Cancer Sci. 2018. PMID: 29465804 Free PMC article. Review.
-
Disodium Cromolyn and Anti-podoplanin Antibodies Strongly Inhibit Growth of BHK 21/C13-derived Fibrosarcoma in a Chick Embryo Chorioallantoic Membrane Model.In Vivo. 2018 Jul-Aug;32(4):791-798. doi: 10.21873/invivo.11309. In Vivo. 2018. PMID: 29936460 Free PMC article.
-
Microvascular Density, Endothelial Area, and Ki-67 Proliferative Index Correlate Each Other in Cat Post-Injection Fibrosarcoma.Cells. 2020 Dec 28;10(1):31. doi: 10.3390/cells10010031. Cells. 2020. PMID: 33379269 Free PMC article.
References
-
- Folkman J, Klagsbrun M. Angiogenic factors. Science 1987; 235: 442–7. - PubMed
-
- Folkman J, Shing Y. Angiogenesis. J Biol Chem 1992; 267: 10931–4. - PubMed
-
- Ferrara N, Kerbel RS. Angiogenesis as a therapeutic target. Nature 2005; 438: 967–74. - PubMed
-
- Kerbel RS. Tumor angiogenesis: past, present and the near future. Carcinogenesis 2000; 21: 505–15. - PubMed
-
- Poon R, Fan ST, Wong J. Clinical implications of circulating angiogenic factors in cancer patients. J Clin Oncol 2001; 19: 1207–25. - PubMed
Publication types
MeSH terms
Substances
LinkOut - more resources
Full Text Sources
Other Literature Sources
Research Materials

