. 2009 Sep 2;97(5):1313-22.
doi: 10.1016/j.bpj.2009.06.021.

Vascular smooth muscle cell durotaxis depends on substrate stiffness gradient strength

Affiliations

Vascular smooth muscle cell durotaxis depends on substrate stiffness gradient strength

Brett C Isenberg et al. Biophys J. .

Abstract

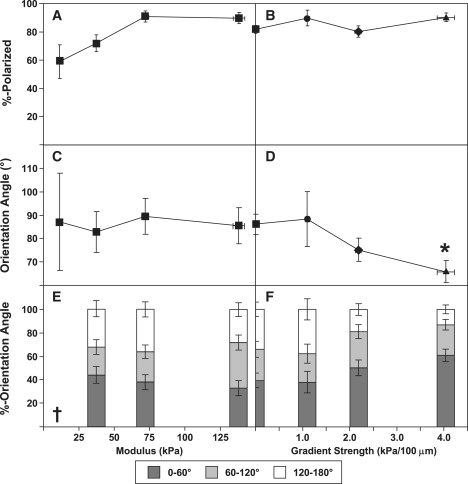
Mechanical compliance is emerging as an important environmental cue that can influence certain cell behaviors, such as morphology and motility. Recent in vitro studies have shown that cells preferentially migrate from less stiff to more stiff substrates; however, much of this phenomenon, termed durotaxis, remains ill-defined. To address this problem, we studied the morphology and motility of vascular smooth muscle cells on well-defined stiffness gradients. Baselines for cell spreading, polarization, and random motility on uniform gels with moduli ranging from 5 to 80 kPa were found to increase with increasing stiffness. Subsequent analysis of the behavior of vascular smooth muscle cells on gradient substrata (0-4 kPa/100 mum, with absolute moduli of 1-80 kPa) demonstrated that the morphology on gradient gels correlated with the absolute modulus. In contrast, durotaxis (evaluated quantitatively as the tactic index for a biased persistent random walk) and cell orientation with respect to the gradient both increased with increasing magnitude of gradient, but were independent of the absolute modulus. These observations provide a foundation for establishing quantitative relationships between gradients in substrate stiffness and cell response. Moreover, these results reveal common features of phenomenological cell response to chemotactic and durotactic gradients, motivating further mechanistic studies of how cells integrate and respond to multiple complex signals.


Figures

Figure 1
Figure 1
Macro- and micromechanical properties of PAAm hydrogels fabricated with uniform bis concentration. (A) Bulk tensile modulus as a function of bis concentration from traditional uniaxial tensile testing. (B) Effective force constant, defined as the slope of the linear region of the indentation curve, as a function of bis concentration from AFM.
Figure 2
Figure 2
Mosaic phase-contrast images of VSMCs on PAAm gels with corresponding plots of modulus as a function of position for gels with (A) 1 kPa/100 μm, (B) 2 kPa/100 μm, and (C) 4 kPa/100 μm gradients in stiffness. Image dimensions map directly to the x axis of the corresponding modulus-position plot. Solid symbols: experimental values based on mapping AFM effective force constant to bulk tensile modulus; open symbols: theoretical predictions based on combining a mixing model (14) with relationships between bis concentration and bulk modulus. Solid lines: linear fits of modulus as a function of position to gradient regions of gels; dotted lines: regions of uniform modulus. Solid symbols (circles, diamonds, and triangles): experimental values; open symbols: from theoretical model.
Figure 3
Figure 3
Fluorescence intensity of gels with immobilized type I collagen-fluorescein as a function of position. (A) Mosaic fluorescence image of a 4 kPa/100 μm gel. Image dimensions map directly to the x axis of the corresponding intensity-position plot. (B) Fluorescence intensity for gradient gels compared with a uniform gel (labeled “0 kPa/100 μm”). The uniform gel was fabricated with 10% AAm and 0.31% bis; this composition was chosen because its bulk tensile modulus (50.1 ± 2.4 kPa) was in the middle of the range of moduli for the gradient gels. Bars represent standard deviations from triplicate measurements.
Figure 4
Figure 4
Polarization and orientation for cells on uniform (A, C, and E) and gradient (B, D, and F) gels. (A and B) Percentage of cells with recognizable lamellipodia. (C and D) Average cell orientation with respect to an arbitrary reference direction for uniform gels (C) and gradient direction for gradient gels (D). A cell orientation of 0° indicates perfect alignment in the direction of the gradient; an orientation of 180° indicates perfect alignment in the direction opposite the gradient. Data labeled with correspond to p < 0.05 compared with uniform gels. (E and F) Histograms of orientation angle. Data for 0 kPa/100 μm were based on pooling data for all uniform gels. Histograms were not statistically distinguishable. The † symbol indicates that only 10 cells were available for this condition, in contrast to >30 cells for all other conditions.
Figure 5
Figure 5
Scatter plots of cell orientation angle on gradient gels as a function of tensile modulus for different gradient strengths: (A) 1 kPa/100 μm, (B) 2 kPa/100 μm, and (C) 4 kPa/100 μm. Vertical dotted lines delimit the range of moduli for individual gradients.
Figure 6
Figure 6
Windrose displays of typical paths of VSMCs over 20-h periods on uniform gels (A, top row) and gradient gels (B, bottom row). Arrows indicate direction of gradient from softer to stiffer region.
Figure 7
Figure 7
Directional motility, evaluated as the TI, for cells on uniform gels (A and C) and gradient gels (B and D). (A and B) Average TI as a function of absolute stiffness for uniform gels (A) and as a function of stiffness gradient for gradient gels (B). Data labeled with correspond to p < 0.05 compared with uniform gels. (C and D) Histograms of TI for uniform gels (C) and gradient gels (D). Histograms were not statistically distinguishable. Data for 0 kPa/100 μm were based on pooled data for all uniform gels.
Figure 8
Figure 8
Scatter plots of TI on gradient gels as a function of tensile modulus for different gradient strengths: (A) 1 kPa/100 μm, (B) 2 kPa/100 μm, and (C) 4 kPa/100 μm. The tensile modulus for each cell corresponds to the modulus for the cell's starting position upon tracking. Vertical dotted lines delimit the range of moduli for individual gradients.

References

    1. Berry M.F., Engler A.J., Woo Y.J., Pirolli T.J., Bish L.T. Mesenchymal stem cell injection after myocardial infarction improves myocardial compliance. Am. J. Physiol. Heart Circ. Physiol. 2006;290:H2196–H2203. - PubMed
    1. Brown X.Q., Ookawa K., Wong J.Y. Evaluation of polydimethylsiloxane scaffolds with physiologically-relevant elastic moduli: interplay of substrate mechanics and surface chemistry effects on vascular smooth muscle cell response. Biomaterials. 2005;26:3123–3129. - PubMed
    1. Engler A., Bacakova L., Newman C., Hategan A., Griffin M. Substrate compliance versus ligand density in cell on gel responses. Biophys. J. 2004;86:617–628. - PMC - PubMed
    1. Thomas T.W., DiMilla P.A. Spreading and motility of human glioblastoma cells on sheets of silicone rubber depend on substratum compliance. Med. Biol. Eng. Comput. 2000;38:360–370. - PubMed
    1. Gray D.S., Tien J., Chen C.S. Repositioning of cells by mechanotaxis on surfaces with micropatterned Young's modulus. J. Biomed. Mater. Res. 2003;66A:605–614. - PubMed

Publication types

LinkOut - more resources