. 2009 Oct 25;393(2):198-209.
doi: 10.1016/j.virol.2009.07.032. Epub 2009 Aug 31.

Infectious entry of equine herpesvirus-1 into host cells through different endocytic pathways

Affiliations

Infectious entry of equine herpesvirus-1 into host cells through different endocytic pathways

Rie Hasebe et al. Virology. .

Abstract

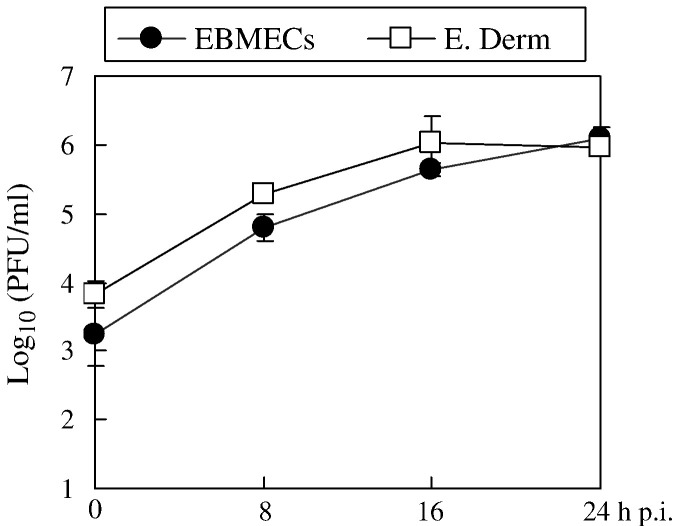
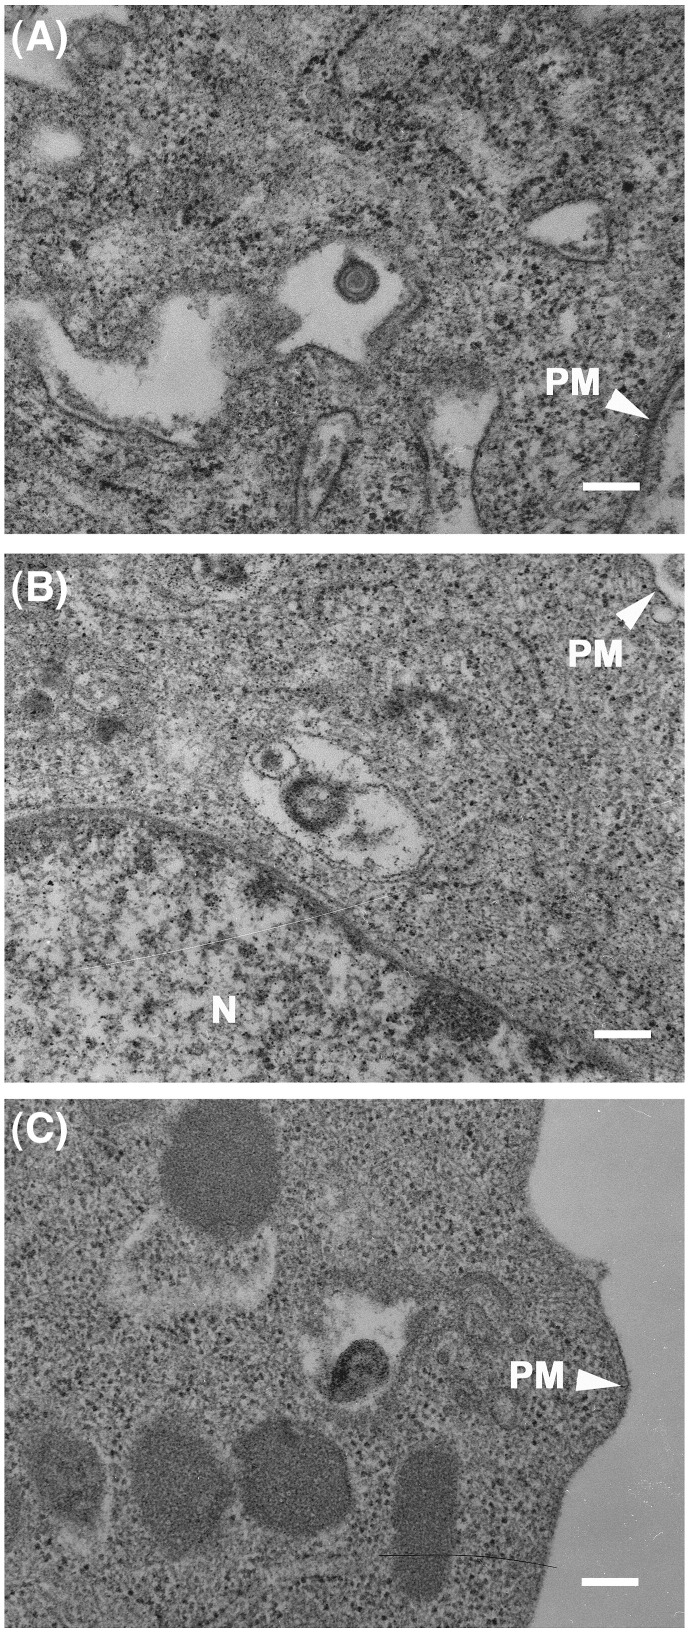
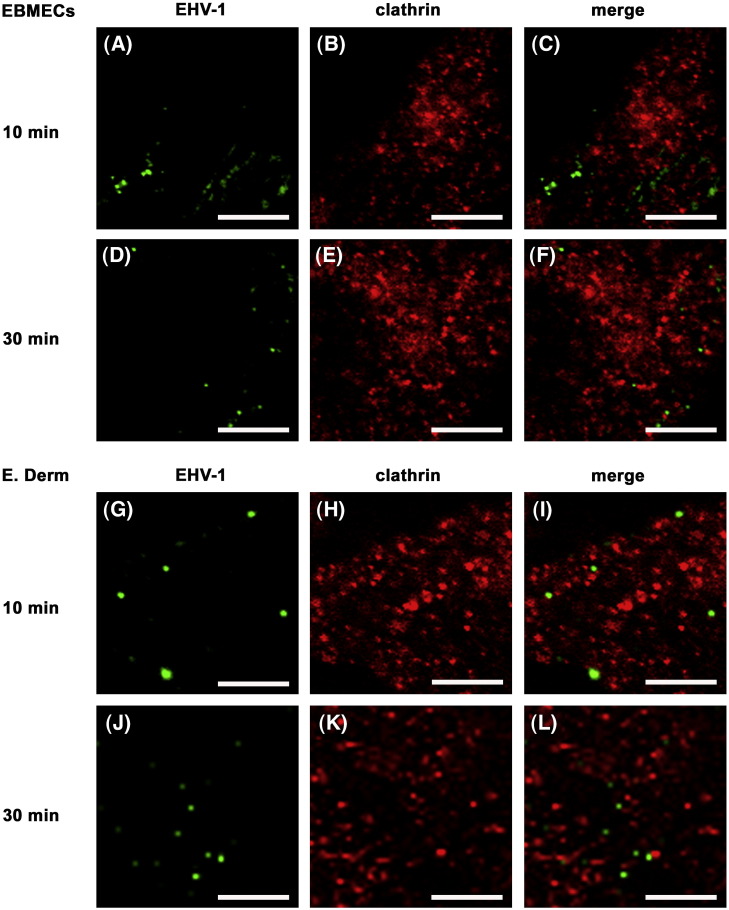
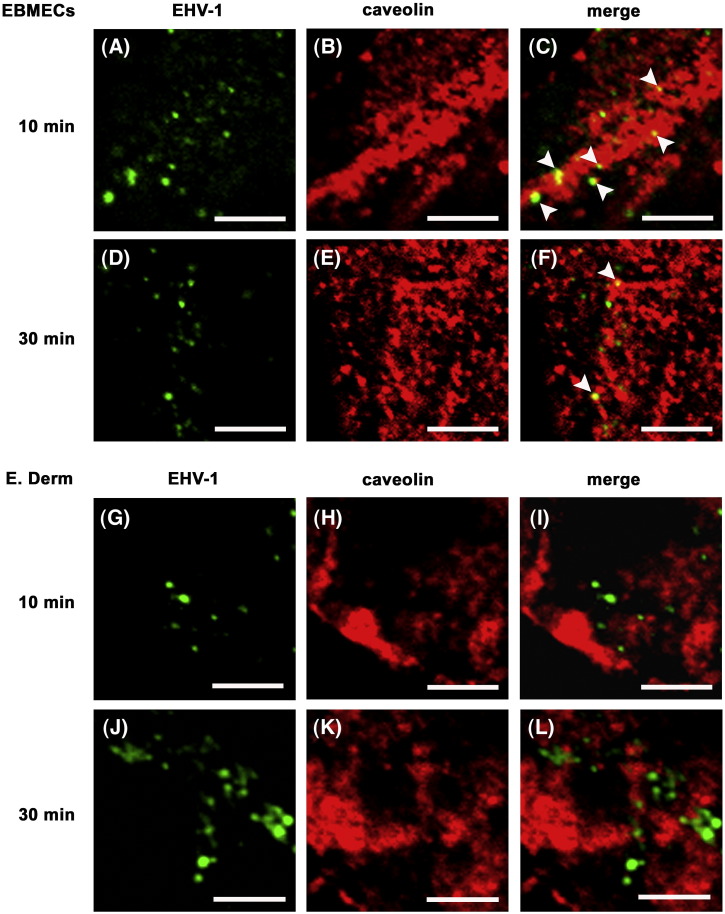
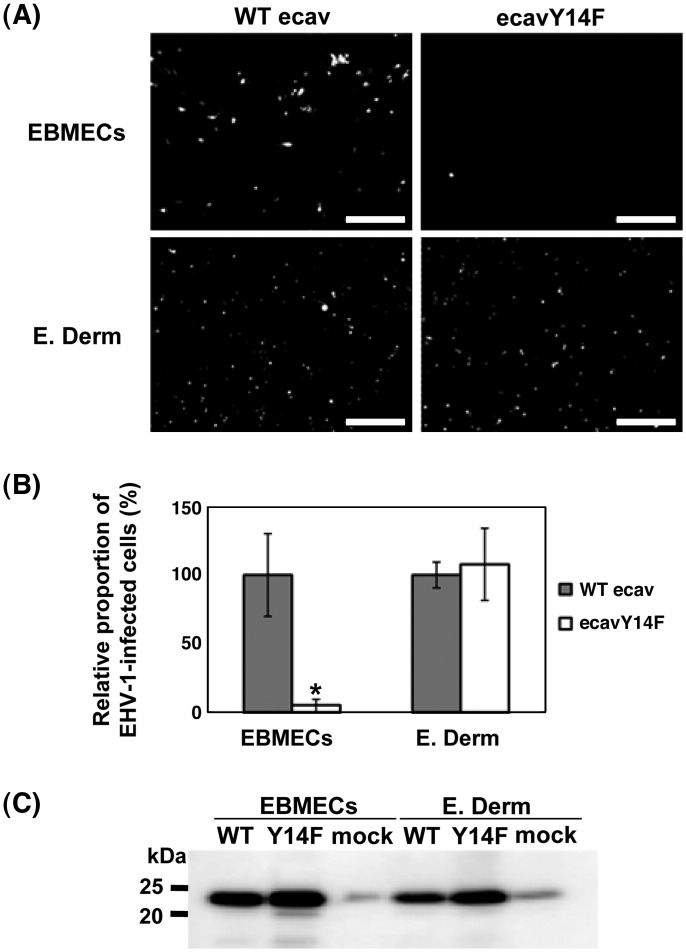
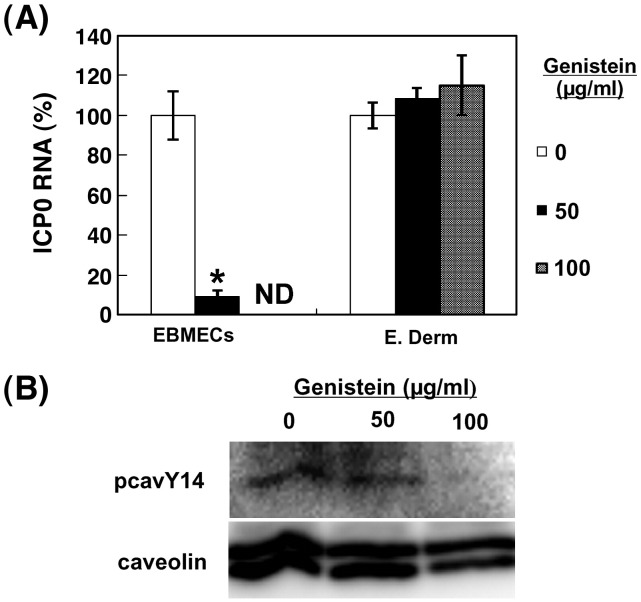
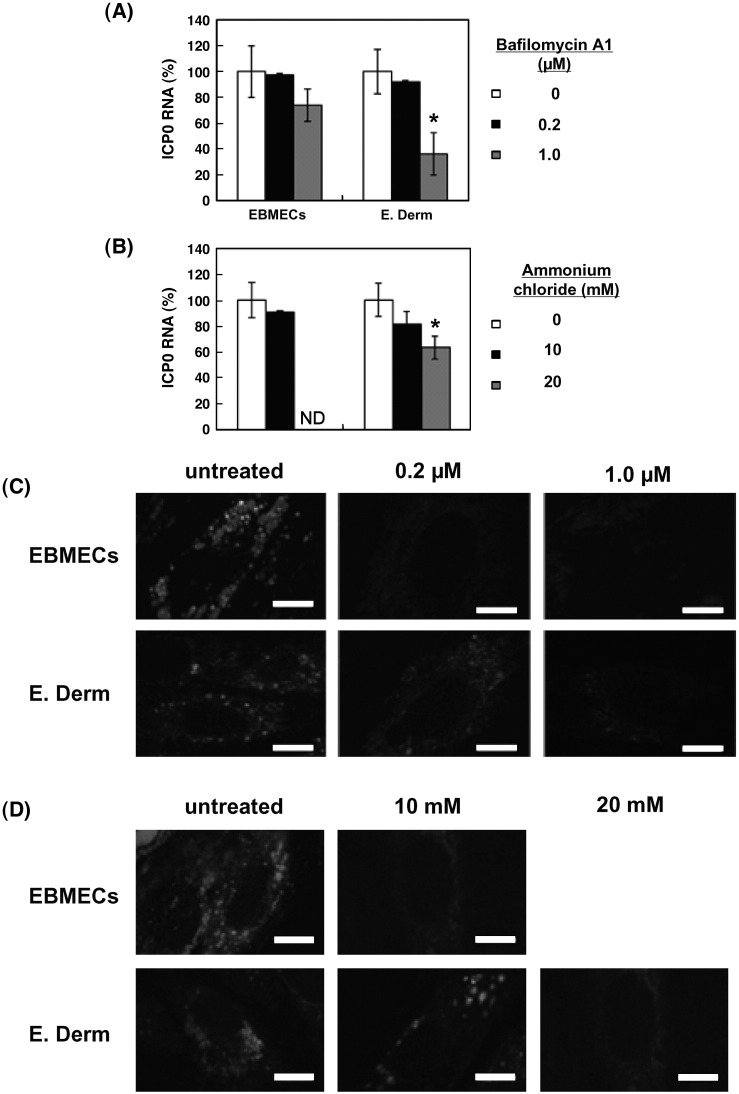
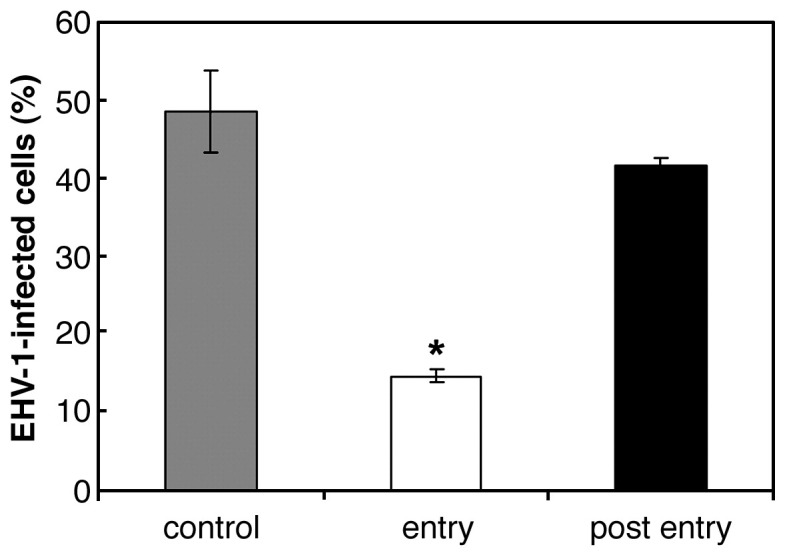
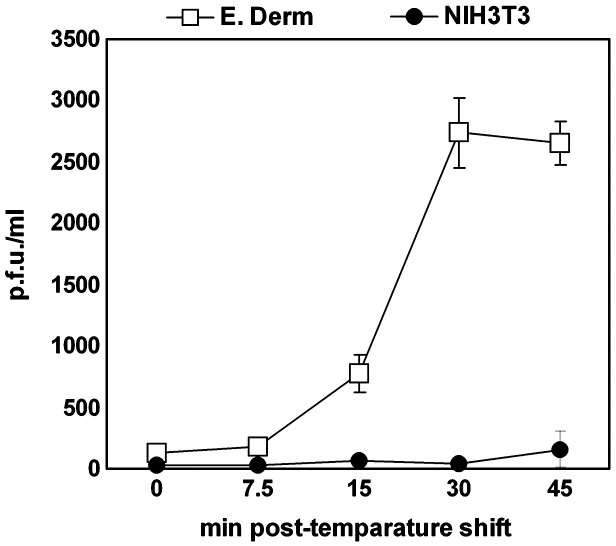
We investigated the mechanism by which equine herpesvirus-1 (EHV-1) enters primary cultured equine brain microvascular endothelial cells (EBMECs) and equine dermis (E. Derm) cells. EHV-1 colocalized with caveolin in EBMECs and the infection was greatly reduced by the expression of a dominant negative form of equine caveolin-1 (ecavY14F), suggesting that EHV-1 enters EBMECs via caveolar endocytosis. EHV-1 entry into E. Derm cells was significantly reduced by ATP depletion and treatments with lysosomotropic agents. Enveloped virions were detected from E. Derm cells by infectious virus recovery assay after viral internalization, suggesting that EHV-1 enters E. Derm cells via energy- and pH-dependent endocytosis. These results suggest that EHV-1 utilizes multiple endocytic pathways in different cell types to establish productive infection.


Figures

Fig. 1
Fig. 1
Viral growth in EBMECs (solid circles) and E. Derm cells (open squares) infected at an m.o.i. of 5 p.f.u. per cell. Each point represents the amount of cell-associated virus as the mean of three determinations. The error bars indicate the SD. The results are representative of 2 independent experiments.
Fig. 2
Fig. 2
Ultrastructural analysis of EHV-1 entry into EBMECs (A) and E. Derm cells (B, C). Cells were incubated with EHV-1 at an m.o.i. of 150 p.f.u. per cell first for 2 h at 4 °C and then for 10 min at 37 °C. Scale bars represent 200 nm. PM, plasma membrane. N, nucleus.
Fig. 3
Fig. 3
Distribution of EHV-1 immunoreactivity and clathrin during viral entry. EBMECs (A–F) and E. Derm cells (G–L) were infected with EHV-1 at an m.o.i. of 10 p.f.u. per cell for 10 (A–C, G–I) or 30 min (D–F, J–L) at 37 °C, fixed, and processed for double immunofluorescence staining of EHV-1 (green) and clathrin-heavy chain (red). Scale bars represent 5 μm.
Fig. 4
Fig. 4
Distribution of EHV-1 gB and caveolin during viral entry. EBMECs (A–F) and E. Derm cells (G–L) were infected with EHV-1 at an m.o.i. of 10 p.f.u. per cell for 10 (A–C, G–I) or 30 min (D–F, J–L) at 37 °C, fixed, and processed for double immunofluorescence staining of EHV-1 gB (green) and caveolin (red). Arrowheads show colocalization of EHV-1 gB and caveolin. Scale bars represent 5 μm.
Fig. 5
Fig. 5
Effects of the expression of a dominant negative form of equine caveolin-1 on EHV-1 infection. Cells expressing WT ecav or ecavY14F were infected with Ab4-GFP at an m.o.i. of 1 per cell for 16 h p.i. (A) The GFP signals in the infected cells were detected by fluorescent microscopy. Scale bars represent 500 μm. (B) The relative proportion of EHV-1 infected cells expressing either WT ecav or ecavY14F determined as described in Materials and methods. The graphs show the mean of three determinations. The error bars show SD. ⁎P < 0.01 versus the control value (Student's t test). The results are representative of 2 independent experiments. (C) Western blotting analysis of the expression of WT ecav (WT) and ecavY14F (Y14F) with rabbit polyclonal antibodies to caveolin. Mock indicates the endogenous expression of caveolin-1 in EBMECs and E. Derm cells.
Fig. 6
Fig. 6
Role of tyrosine phosphorylation of caveolin in EHV-1 entry. (A) Effects of genistein on EHV-1 entry into EBMECs and E. Derm cells. Cells were incubated with the indicated concentrations of genistein for 1 h at 37 °C, infected with EHV-1 at an m.o.i. of 5 p.f.u. per cell for 1 h, and then incubated for an additional 2 h in the continued presence of genistein. The amount of EHV-1 ICP0 RNA was normalized by the amount of GAPDH mRNA and then expressed as a percentage of the value for infected cells not treated with genistein (control). ⁎P < 0.001 versus the corresponding control value (Student's t test). ND, not determined. The graphs show the mean of three determinations. The error bars show SD. The results are representative of 2 dependent experiments. (B) Effects of genistein on tyrosine phosphorylation in E. Derm cells. Cells were incubated with the indicated concentrations of genistein for 1 h at 37 °C, collected in lysis buffer. The cell lysates were immunoprecipitated with rabbit polyclonal antibodies to caveolin and the immunoprecipitates were subjected to Western blotting with a specific antibody to phosphorylated caveolin-1 at residue 14 (pcavY14).
Fig. 7
Fig. 7
Role of a low pH in intracellular organelles in EHV-1 entry. (A) Effects of bafilomycin A1 on EHV-1 entry into EBMECs and E. Derm cells. Cells were incubated with the indicated concentrations of bafilomycin A1 for 1 h at 37 °C, infected with EHV-1 at an m.o.i. of 5 p.f.u. per cell for 1 h, and then incubated for an additional 2 h in the continued presence of test agent. The amount of EHV-1 ICP0 RNA was normalized by the amount of GAPDH mRNA and then expressed as a percentage of the value for infected cells not treated with reagent (control). ⁎P < 0.01 versus the corresponding control value (Student's t test). The graphs show the mean of three determinations. The error bars show SD. The results are representative of 2 independent experiments. (B) Effects of ammonium chloride on EHV-1 entry into EBMECs and E. Derm cells. Viral entry was evaluated by the amount of EHV-1 ICP0 RNA with normalization by the amount of GAPDH mRNA. ⁎P < 0.01 versus the corresponding control value (Student's t test). ND, not determined. The graphs show the mean of three determinations. The error bars show SD. The results are representative of 2 independent experiments. (C) Evaluation of the effects of bafilomycin A1 on lysosomal pH in EBMECs and E. Derm cells. Cells were incubated with the indicated concentrations of bafilomycin A1 for 1 h at 37 °C and exposed to LysoSensor Yellow/Blue DND-160. The pH in acidic organelles was evaluated by the fluorescence intensity of LysoSensor Yellow/Blue DND-160. Scale bars represent 10 μm. (D) Evaluation of the effects of ammonium chloride on lysosomal pH in EBMECs and E. Derm cells with LysoSensor Yellow/Blue DND-160. Scale bars represent 10 μm.
Fig. 8
Fig. 8
Effect of ATP depletion on EHV-1 entry into E. Derm cells. The cells were treated with ATP depletion media during (white bar) or post viral entry (black bar). For the untreated control (gray bar), the cells were incubated in FBS-free media. The cells were infected with Ab4-GFP at an m.o.i. of 5 per cell and EHV-1 infected cells were counted by FACS. ⁎P < 0.001 versus the corresponding control value (Student's t test). The graphs show the mean of three determinations. The error bars show SD. The results are representative of 2 independent experiments.
Fig. 9
Fig. 9
Infectious virus recovery assay. E. Derm (open square) and NIH3T3 cells (solid circle) were infected with EHV-1 at an m.o.i. of 10 per cell at 4 °C for 2 h. Then the cells were shifted to 37 °C to allow viral internalization. At the indicated times, the remaining viruses on the cell surface were inactivated by acidic buffer. Internalized infectious viruses were detected by titration on RK13 cells. The graphs show the mean of three determinations. The error bars show SD.

Similar articles

Cited by

References

    1. Abodeely R.A., Lawson L.A., Randall C.C. Morphology and entry of enveloped and deenveloped equine abortion (herpes) virus. J. Virol. 1970;5:513–523. - PMC - PubMed
    1. Akiyama T., Ishida J., Nakagawa S., Ogawara H., Watanabe S., Itoh N., Shibuya M., Fukami Y. Genistein, a specific inhibitor of tyrosine-specific protein kinases. J. Biol. Chem. 1987;262:5592–5595. - PubMed
    1. Anderson R.G. The caveolae membrane system. Annu. Rev. Biochem. 1998;67:199–225. - PubMed
    1. Anderson H.A., Chen Y., Norkin L.C. Bound simian virus 40 translocates to caveolin-enriched membrane domains, and its entry is inhibited by drugs that selectively disrupt caveolae. Mol. Biol. Cell. 1996;7:1825–1834. - PMC - PubMed
    1. Aoki T., Nomura R., Fujimoto T. Tyrosine phosphorylation of caveolin-1 in the endothelium. Exp. Cell Res. 1999;253:629–636. - PubMed

Publication types