. 2009 Nov;77(11):5025-34.
doi: 10.1128/IAI.00224-09. Epub 2009 Aug 31.

Patients with multidrug-resistant tuberculosis display impaired Th1 responses and enhanced regulatory T-cell levels in response to an outbreak of multidrug-resistant Mycobacterium tuberculosis M and Ra strains

Affiliations

Patients with multidrug-resistant tuberculosis display impaired Th1 responses and enhanced regulatory T-cell levels in response to an outbreak of multidrug-resistant Mycobacterium tuberculosis M and Ra strains

Laura Geffner et al. Infect Immun. 2009 Nov.

Abstract

In Argentina, multidrug-resistant tuberculosis (MDR-TB) outbreaks emerged among hospitalized patients with AIDS in the early 1990s and thereafter disseminated to the immunocompetent community. Epidemiological, bacteriological, and genotyping data allowed the identification of certain MDR Mycobacterium tuberculosis outbreak strains, such as the so-called strain M of the Haarlem lineage and strain Ra of the Latin America and Mediterranean lineage. In the current study, we evaluated the immune responses induced by strains M and Ra in peripheral blood mononuclear cells from patients with active MDR-TB or fully drug-susceptible tuberculosis (S-TB) and in purified protein derivative-positive healthy controls (group N). Our results demonstrated that strain M was a weaker gamma interferon (IFN-gamma) inducer than H37Rv for group N. Strain M induced the highest interleukin-4 expression in CD4+ and CD8+ T cells from MDR- and S-TB patients, along with the lowest cytotoxic T-lymphocyte (CTL) activity in patients and controls. Hence, impairment of CTL activity is a hallmark of strain M and could be an evasion mechanism employed by this strain to avoid the killing of macrophages by M-specific CTL effectors. In addition, MDR-TB patients had an increased proportion of circulating regulatory T cells (Treg cells), and these cells were further expanded upon in vitro M. tuberculosis stimulation. Experimental Treg cell depletion increased IFN-gamma expression and CTL activity in TB patients, with M- and Ra-induced CTL responses remaining low in MDR-TB patients. Altogether, these results suggest that immunity to MDR strains might depend upon a balance between the individual host response and the ability of different M. tuberculosis genotypes to drive Th1 or Th2 profiles.


Figures

FIG. 1.
FIG. 1.
Spoligotyping and IS6110-restriction fragment length polymorphism pattern profiles of M. tuberculosis strains used as antigens in this study, including reference virulent strain H37Rv and local MDR strains M, 410, and Ra.
FIG. 2.
FIG. 2.
H37Rv, M, and Ra induce IL-10 in CD4+ and CD8+ T cells. PBMC from 25 MDR-TB and 20 S-TB patients and from 10 PPD+ healthy individuals (N) were cultured for 5 days alone (white bars) or with H37Rv (lightest gray bars), M (light gray bars), or Ra (dark gray bars). The proportions of CD4+ and CD8+ T cells expressing IL-10 were determined by flow cytometry. Results are expressed as percentages of CD4+ IL-10+ and CD8+ IL-10+ cells in the lymphocyte gate; medians and 25th to 75th percentiles are shown. *, P < 0.05 for M. tuberculosis-stimulated versus nonstimulated PBMC; a, P < 0.05 for MDR-TB patients versus group N controls.
FIG. 3.
FIG. 3.
H37Rv, M, and Ra induce different proportions of IL-4 in CD4+ and CD8+ T cells from TB patients. PBMC from 25 MDR-TB and 20 S-TB patients and from 10 group N controls were cultured for 5 days alone (white bars) or with H37Rv (lightest gray bars), M (light gray bars), or Ra (dark gray bars). The percentages of CD4+ IL-4+ and CD8+ IL-4+ cells were determined by flow cytometry, and results are expressed as medians and 25th to 75th percentiles. *, P < 0.05 for M. tuberculosis-stimulated versus nonstimulated PBMC; §, P < 0.05 for M versus H37Rv or Ra; a, P < 0.05 for MDR-TB or S-TB patients versus group N controls.
FIG. 4.
FIG. 4.
H37Rv, M, and Ra induce different proportions of IFN-γ in CD4+ and CD8+ T cells in TB patients and group N controls. PBMC from 25 MDR-TB and 20 S-TB patients and from 10 group N controls were cultured for 5 days alone (white bars) or with H37Rv (lightest gray bars), M (light gray bars), or Ra (dark gray bars). The percentages of CD4+ IFN-γ+ and CD8+ IFN-γ+ cells were determined by flow cytometry, and results are expressed as medians and 25th to 75th percentiles. *, P < 0.05 for M. tuberculosis-stimulated versus nonstimulated PBMC; a, P < 0.05 for patients versus group N controls; §, P < 0.05 for M versus H37Rv or Ra.
FIG. 5.
FIG. 5.
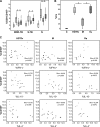
CD8+ T cells from TB patients express low levels of CD107 surface molecules. PBMC from 20 MDR-TB and 16 S-TB patients and 10 group N controls were cultured for 5 days alone (C; white bars) or with H37Rv (lightest gray bars), M (light gray bars), or Ra (dark gray bars). (A) Control and M. tuberculosis-stimulated CD8+ T cells were tested for CD107 surface expression by flow cytometry. Results are expressed as percentages of CD107+ cells in the CD8+ lymphocyte gate (medians and 25th to 75th percentiles). *, P < 0.05 for M. tuberculosis-stimulated versus nonstimulated PBMC; §, P < 0.05 for M versus H37Rv or Ra; #, P < 0.05 for MDR-TB versus S-TB patients; a, P < 0.05 for MDR-TB patients versus group N controls. (B) Control and M. tuberculosis-stimulated PBMC from 10 group N controls were tested for lytic ability against autologous M. tuberculosis-pulsed macrophages, employing a 51Cr release assay. Results are expressed as percentages of cytotoxicity (%Cx) (medians and 25th to 75th percentiles). *, P < 0.05 for M. tuberculosis-stimulated versus control PBMC; §, P < 0.05 for M versus H37Rv or Ra. (C) Correlation between % CD107+ CD8+ cells and % IL-10+, IL-4+, or IFN-γ+ cells in M. tuberculosis-stimulated CD8+ T cells from MDR-TB (triangles) and S-TB (inverted triangles) patients and group N controls (circles). Individual data and Spearman rho coefficients are shown.
FIG. 6.
FIG. 6.
Expansion of CD4+ CD25+ Foxp3+ cells is not dependent on M. tuberculosis strain stimulation. PBMC from 25 MDR-TB and 20 S-TB patients and 10 group N controls were cultured for 5 days alone (white bars) or with H37Rv (lightest gray bars), M (light gray bars), or Ra (dark gray bars). The percentages of CD25+ Foxp3+ cells in CD4+ T cells were determined by flow cytometry. Results are expressed as medians and 25th to 75th percentiles. *, P < 0.05 for M. tuberculosis-stimulated versus nonstimulated PBMC; a, P < 0.05 for MDR-TB or S-TB patients versus group N controls; #, P < 0.05 for MDR-TB versus S-TB patients.
FIG. 7.
FIG. 7.
CD25 depletion enhances IFN-γ expression on antigen-stimulated CD4+ and CD8+ T cells. PBMC from 10 MDR-TB and 8 S-TB patients and 6 group N controls were depleted of CD25+ cells by magnetic methods. PBMC (white bars) and CD25-depleted cells (gray bars) were cultured for 5 days with M. tuberculosis strains and tested for IFN-γ expression. Results are expressed as % CD4+ IFN-γ+ or CD8+ IFN-γ+ cells (medians and 25th to 75th percentiles). †, P < 0.05 for PBMC versus CD25-depleted PBMC; a, P < 0.05 for MDR-TB patients versus group N controls; #, P < 0.05 for MDR-TB versus S-TB patients.
FIG. 8.
FIG. 8.
CD25 depletion decreases IL-10 expression on antigen-stimulated CD4+ and CD8+ T cells. PBMC (white bars) and CD25-depleted cells (gray bars) from 10 MDR-TB and 8 S-TB patients and 6 group N controls were cultured for 5 days with M. tuberculosis strains and tested for IL-10 expression. Results are expressed as % CD4+ IL-10+ or % CD8+ IL-10+ cells (medians and 25th to 75th percentiles). †, P < 0.05 for PBMC versus CD25-depleted PBMC.
FIG. 9.
FIG. 9.
CD25 depletion enhances CD107 expression on antigen-stimulated CD4+ and CD8+ T cells. PBMC from 10 MDR-TB and 8 S-TB patients and 6 group N controls were depleted of CD25+ cells by magnetic methods. PBMC (white bars) and CD25-depleted cells (gray bars) were cultured for 5 days with H37Rv, M, or Ra and tested for CD107 expression. Results are expressed as % CD107+ cells in CD8+ T cells (medians and 25th to 75th percentiles). †, P < 0.05 for PBMC versus CD25-depleted PBMC; a, P < 0.05 for MDR-TB patients versus group N controls; #, P < 0.05 for MDR-TB versus S-TB patients.

References

    1. Aita, J., L. Barrera, A. Reniero, B. López, J. Biglione, G. Weisburd, J. C. Rajmil, C. Largacha, and V. Ritacco. 1996. Hospital transmission of multidrug-resistant Mycobacterium tuberculosis in Rosario, Argentina. Medicina (Buenos Aires) 56:48-50. - PubMed
    1. Betts, M. R., J. M. Brenchley, D. A. Price, S. C. De Rosa, D. C. Douek, M. Roederer, and R. A. Koup. 2003. Sensitive and viable identification of antigen-specific CD8+ T cells by a flow cytometric assay for degranulation. J. Immunol. Methods 281:65-78. - PubMed
    1. Boyum, A. 1968. Isolation of mononuclear cells and granulocytes from human blood. Isolation of mononuclear cells by one centrifugation, and of granulocytes by combining centrifugation and sedimentation at 1 g. Scand. J. Clin. Lab. Investig. 97(Suppl.):77-89. - PubMed
    1. Castro, A. Z., B. M. Díaz-Bardalez, E. C. Oliveira, R. C. García, J. B. Afiune, I. A. Paschoal, and L. M. Santos. 2005. Abnormal production of transforming growth factor beta and interferon gamma by peripheral blood cells of patients with multidrug-resistant pulmonary tuberculosis in Brazil. J. Infect. 51:318-324. - PubMed
    1. Caws, M., G. Thwaites, S. Dunstan, T. R. Hawn, N. T. Lan, N. T. Thuong, K. Stepniewska, M. N. Huyen, N. D. Bang, T. H. Loc, S. Gagneux, D. van Soolingen, K. Kremer, M. van der Sande, P. Small, P. T. Anh, N. T. Chinh, H. T. Quy, N. T. Duyen, D. Q. Tho, N. T. Hieu, E. Torok, T. T. Hien, N. H. Dung, N. T. Nhu, P. M. Duy, N. van Vinh Chau, and J. Farrar. 2008. The influence of host and bacterial genotype on the development of disseminated disease with Mycobacterium tuberculosis. PLoS Pathog. 4:e1000034. - PMC - PubMed

Publication types

MeSH terms