. 2009 Dec;58(12):2851-62.
doi: 10.2337/db09-0685. Epub 2009 Aug 31.

Glucagon-like peptide-1 agonists protect pancreatic beta-cells from lipotoxic endoplasmic reticulum stress through upregulation of BiP and JunB

Affiliations

Glucagon-like peptide-1 agonists protect pancreatic beta-cells from lipotoxic endoplasmic reticulum stress through upregulation of BiP and JunB

Daniel A Cunha et al. Diabetes. 2009 Dec.

Abstract

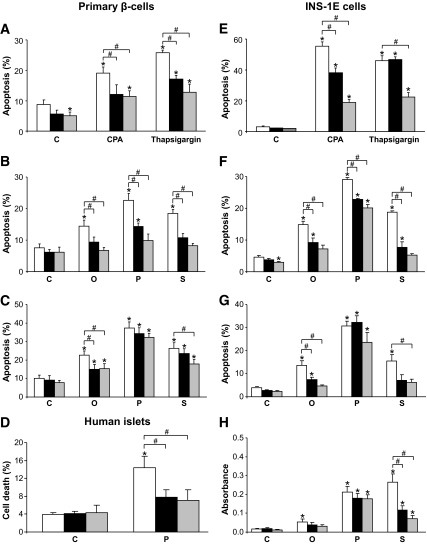
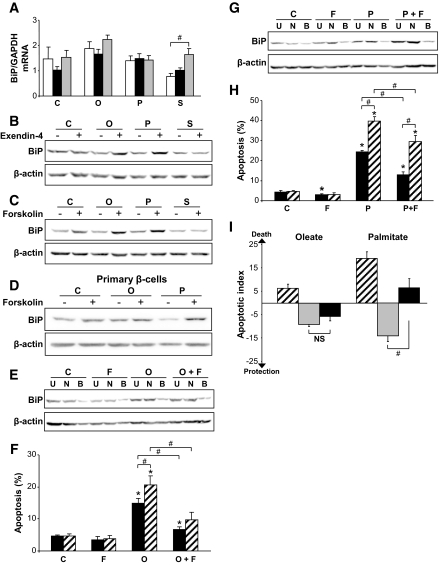
Objective: Chronic exposure of pancreatic beta-cells to saturated free fatty acids (FFAs) causes endoplasmic reticulum (ER) stress and apoptosis and may contribute to beta-cell loss in type 2 diabetes. Here, we evaluated the molecular mechanisms involved in the protection of beta-cells from lipotoxic ER stress by glucagon-like peptide (GLP)-1 agonists utilized in the treatment of type 2 diabetes.

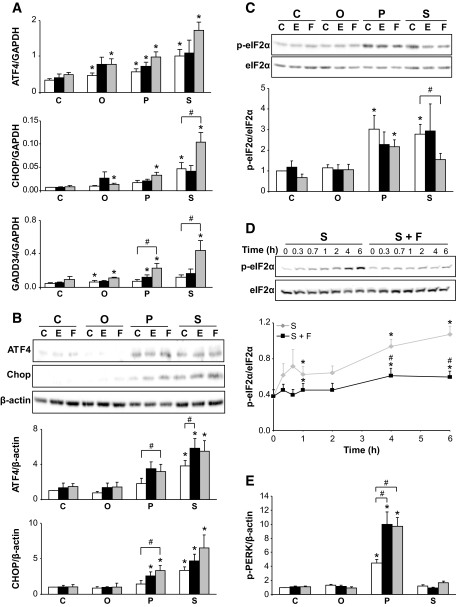
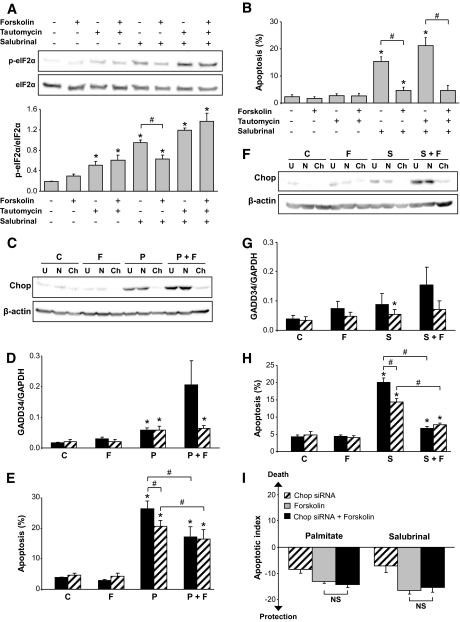
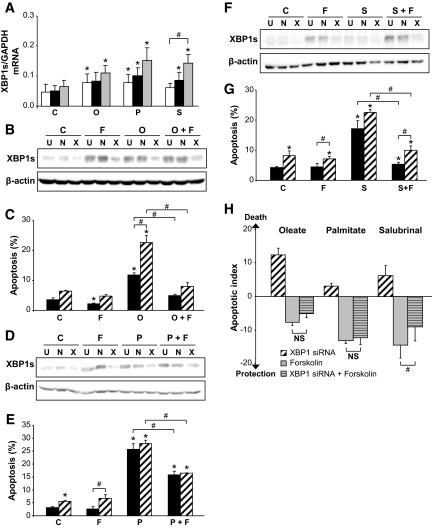
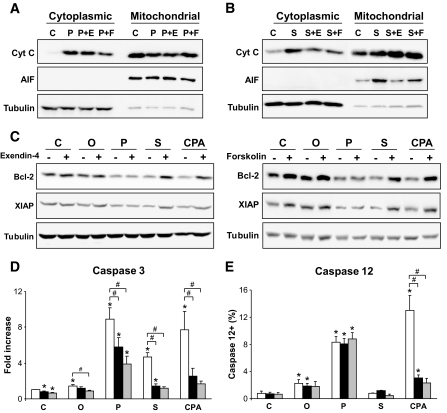
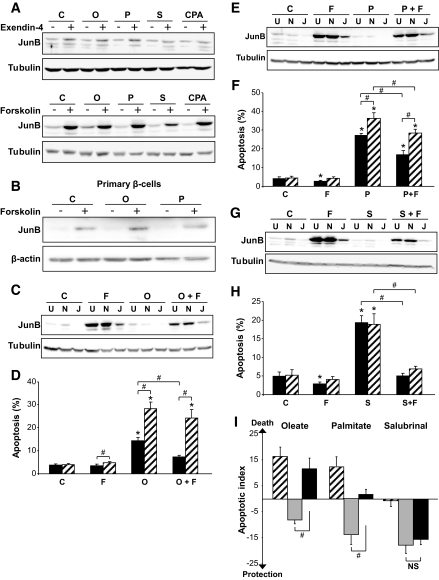
Research design and methods: INS-1E or fluorescence-activated cell sorter-purified primary rat beta-cells were exposed to oleate or palmitate with or without the GLP-1 agonist exendin-4 or forskolin. Cyclopiazonic acid was used as a synthetic ER stressor, while the activating transcription factor 4-C/EBP homologous protein branch was selectively activated with salubrinal. The ER stress signaling pathways modulated by GLP-1 agonists were studied by real-time PCR and Western blot. Knockdown by RNA interference was used to identify mediators of the antiapoptotic GLP-1 effects in the ER stress response and downstream mitochondrial cell death mechanisms.

Results: Exendin-4 and forskolin protected beta-cells against FFAs via the induction of the ER chaperone BiP and the antiapoptotic protein JunB that mediate beta-cell survival under lipotoxic conditions. On the other hand, exendin-4 and forskolin protected against synthetic ER stressors by inactivating caspase 12 and upregulating Bcl-2 and X-chromosome-linked inhibitor of apoptosis protein that inhibit mitochondrial apoptosis.

Conclusions: These observations suggest that GLP-1 agonists increase in a context-dependent way the beta-cell defense mechanisms against different pathways involved in ER stress-induced apoptosis. The identification of the pathways modulated by GLP-1 agonists allows for targeted approaches to alleviate beta-cell ER stress in diabetes.


Figures

FIG. 1.
FIG. 1.
Exendin-4 and forskolin protect β-cells against ER stress–mediated apoptosis. Primary rat β-cells (A–C), human islets (D), or INS-1E cells (E–H) were left untreated (C) or treated with 25 μmol/l CPA, 1 μmol/l thapsigargin, 0.5 mmol/l oleate (O) or palmitate (P), or 75 μmol/l salubrinal (S), alone (control, □) or in combination with exendin-4 (10 nmol/l for primary cells or 50 nmol/l for INS-1E cells, ■) or forskolin (20 μmol/l, ▩) for 14 h (F), 24 h (A, B, E, G, and H), and 3 days (C and D). Apoptosis was measured by fluorescence microscopy (A–G) or enzyme-linked immunosorbent assay (H). Results represent means ± SE of 3–11 independent experiments. *P < 0.05 for the comparison against untreated cells; #P < 0.05.
FIG. 2.
FIG. 2.
Exendin-4 or forskolin increases signaling downstream of PERK. INS-1E cells were cultured in the presence or absence of 0.5 mmol/l oleate (O) or palmitate (P) or 75 μmol/l salubrinal (S), alone or in combination with 50 nmol/l exendin-4 (E) or 20 μmol/l forskolin (F) for the indicated times (D) or 14 h (A–C and E). □, control; ■, exendin-4; ▩, forskolin. ATF4, CHOP, and GADD34 mRNA expression was analyzed by real-time PCR, normalized for the expression level of the housekeeping gene GAPDH (A). ATF4 and CHOP (B) and phospho-PERK (E) protein expression was analyzed by Western blot, normalized for the expression level of β-actin, and expressed as fold induction of control. eIF2α phosphorylation (C and D) was normalized for total eIF2α. Results represent means ± SE of 3–5 independent experiments. *P < 0.05 against untreated cells; #P < 0.05.
FIG. 3.
FIG. 3.
ATF4-CHOP feedback does not mediate antiapoptotic effects of exendin-4 and forskolin. A: Forskolin (20 μmol/l) decreases eIF2α phosphorylation induced by salubrinal (75 μmol/l) but not by the PP1 inhibitor tautomycin (30 nmol/l) after 14 h. The blot is representative of three independent experiments; densitometric quantification of eIF2α phosphorylation expressed per total eIF2α is shown below. B: Apoptotic INS-1E cell death following 14 h exposure to salubrinal, tautomycin, and/or forskolin. Data are means ± SE of four independent experiments. Representative blot of CHOP protein (C and F) and GADD34 mRNA expression (D and G) following CHOP knockdown and 14-h incubation with palmitate (P) or salubrinal (S), alone or in combination with forskolin (F). C–H: Cells were left untransfected (U) or transfected with negative siRNA (N, ■) or CHOP siRNA (Ch, ▨) 2 days before treatment. E and H: Apoptosis following CHOP knockdown and exposure for 14 h to palmitate (P) or salubrinal (S), alone or in combination with forskolin (F). Data are means ± SE of four independent experiments. I: Data from E and H are presented as apoptotic index. Negative index values indicate protection against apoptosis by CHOP siRNA (▨), forskolin (▩), or the combination of both (■). The lack of difference between CHOP siRNA + forskolin and forskolin illustrates that CHOP does not contribute to the protective effect of forskolin against palmitate or salubrinal. *P < 0.05 against untreated cells; #P < 0.05.
FIG. 4.
FIG. 4.
XBP1 splicing does not mediate forskolin protection against FFA- or salubrinal-induced cell death. A: XBP1s mRNA expression in INS-1E cells exposed for 14 h to 0.5 mmol/l oleate (O) or palmitate (P) or 75 μmol/l salubrinal (S), alone (control, □) or in combination with 50 nmol/l exendin-4 (E, ■) or 20 μmol/l forskolin (F, ▩). Data are means ± SE of five independent experiments. B, D, and F: Representative blots of XBP1 protein expression after 14-h incubation with oleate (O), palmitate (P), or salubrinal (S), alone or in combination with forskolin (F), in cells left untransfected (U) or transfected with negative siRNA (N) or XBP1 siRNA (X) 2 days before treatment (from two to three similar experiments). C, E, and G: Apoptosis was measured under conditions of B, D, and F. Data are means ± SE of three to five independent experiments. ■, negative siRNA; ▨, XBP1 siRNA. H: Data from D, F, and H are presented as apoptotic index. *P < 0.05 against untreated cells; #P < 0.05.
FIG. 5.
FIG. 5.
Increased BiP expression contributes to forskolin protection against palmitate. BiP mRNA (A) and protein expression (B and C) in INS-1E cells or primary rat β-cells (D) exposed for 14 h (A–C) or 24 h (D) to 0.5 mmol/l oleate (O) or palmitate (P) or 75 μmol/l salubrinal (S), alone or in combination with 50 nmol/l exendin-4 or 20 μmol/l forskolin. A: □, control; ■, exendin-4; ▩, forskolin. Data are means ± SE of four to five independent experiments. E and G: Representative blots of BiP protein expression after 14-h incubation with palmitate (P) or oleate (O), alone or in combination with forskolin (F), in cells left untransfected (U) or transfected with negative (N) or BiP siRNA (B) 4 days before treatment (representative of three similar experiments). F and H: Apoptosis was measured under conditions as in E and G. Data are means ± SE of four independent experiments. ■, negative siRNA; ▨, BiP siRNA. I: Data from F and H are presented as apoptotic index. ▨, BiP siRNA; ▩, forskolin; ■, BiP siRNA + forskolin. *P < 0.05 against untreated cells; #P < 0.05.
FIG. 6.
FIG. 6.
Exendin-4 and forskolin modulate ER and mitochondria apoptosis pathways. A and B: Cytochrome C release in INS-1E cells treated for 14 h in the presence or absence of 0.5 mmol/l palmitate (P) or 75 μmol/l salubrinal (S) alone or in combination with 50 nmol/l exendin-4 (E) or 20 μmol/l forskolin (F). Representative blots of cytochrome C (Cyt C), AIF, and tubulin are shown (for four similar experiments). C: Representative blots of Bcl-2 and XIAP protein in INS-1E cells incubated for 14 h with 0.5 mmol/l oleate (O), palmitate, salubrinal, or 25 μmol/l CPA alone or in combination with exendin-4 or forskolin. D and E: Caspase 3 activity and percentage of caspase 12–positive INS-1E cells after 14-h treatment. Data are means ± SE of three to seven independent experiments. □, control; ■, exendin-4; ▩, forskolin. *P < 0.05 against untreated cells; #P < 0.05.
FIG. 7.
FIG. 7.
Increased JunB expression by exendin-4 and forskolin mediates protection against lipotoxic ER stress. JunB protein expression in INS-1E cells cultured for 14 h (A) or primary rat β-cells cultured for 24 h (B) with 0.5 mmol/l oleate (O) or palmitate (P), 75 μmol/l salubrinal (S) or 25 μmol/l CPA, alone or in combination with 50 nmol/l exendin-4 or 20 μmol/l forskolin. C, E, and G: Representative blots of JunB protein expression after 14-h exposure to oleate, palmitate, or salubrinal, alone or in combination with forskolin (F), in cells left untransfected (U) or transfected with negative (N) or JunB siRNA (J) 2 days before treatment (from two to three similar experiments). D, F, and H: Apoptosis following RNAi under conditions as in C, E, and G. Data are means ± SE of three to four independent experiments. ■, negative siRNA; ▨, JunB siRNA. I: Data from D, F, and H are presented as apoptotic index. ▨, JunB siRNA; ▩, forskolin; ■, JunB siRNA + forskolin. *P < 0.05 against untreated cells; #P < 0.05.

References

    1. Ferrannini E, Gastaldelli A, Miyazaki Y, Matsuda M, Mari A, DeFronzo RA: β-Cell function in subjects spanning the range from normal glucose tolerance to overt diabetes: a new analysis. J Clin Endocrinol Metab 2005; 90: 493– 500 - PubMed
    1. Cnop M, Vidal J, Hull RL, Utzschneider KM, Carr DB, Schraw T, Scherer PE, Boyko EJ, Fujimoto WY, Kahn SE: Progressive loss of β-cell function leads to worsening glucose tolerance in first-degree relatives of subjects with type 2 diabetes. Diabetes Care 2007; 30: 677– 682 - PubMed
    1. Florez JC: Newly identified loci highlight beta cell dysfunction as a key cause of type 2 diabetes: where are the insulin resistance genes? Diabetologia 2008; 51: 1100– 1110 - PubMed
    1. Butler AE, Janson J, Bonner-Weir S, Ritzel R, Rizza RA, Butler PC: β-Cell deficit and increased β-cell apoptosis in humans with type 2 diabetes. Diabetes 2003; 52: 102– 110 - PubMed
    1. Rahier J, Guiot Y, Goebbels RM, Sempoux C, Henquin JC: Pancreatic β-cell mass in European subjects with type 2 diabetes. Diabetes Obes Metab 2008; 10( Suppl. 4): 32– 42 - PubMed

Publication types

MeSH terms