. 2009 Dec;58(12):2954-61.
doi: 10.2337/db09-0787. Epub 2009 Aug 31.

Severe insulin resistance and intrauterine growth deficiency associated with haploinsufficiency for INSR and CHN2: new insights into synergistic pathways involved in growth and metabolism

Affiliations

Severe insulin resistance and intrauterine growth deficiency associated with haploinsufficiency for INSR and CHN2: new insights into synergistic pathways involved in growth and metabolism

Sara G I Suliman et al. Diabetes. 2009 Dec.

Abstract

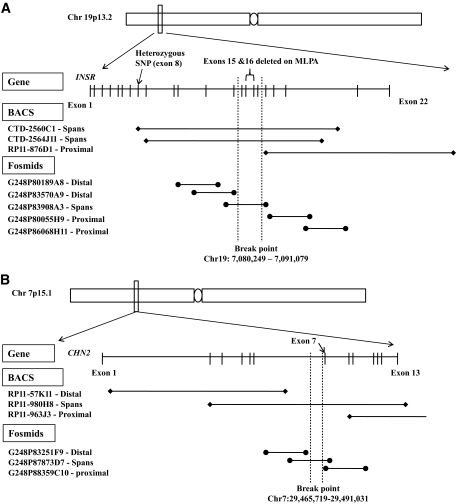
Objective: Digenic causes of human disease are rarely reported. Insulin via its receptor, which is encoded by INSR, plays a key role in both metabolic and growth signaling pathways. Heterozygous INSR mutations are the most common cause of monogenic insulin resistance. However, growth retardation is only reported with homozygous or compound heterozygous mutations. We describe a novel translocation [t(7,19)(p15.2;p13.2)] cosegregating with insulin resistance and pre- and postnatal growth deficiency. Chromosome translocations present a unique opportunity to identify modifying loci; therefore, our objective was to determine the mutational mechanism resulting in this complex phenotype.

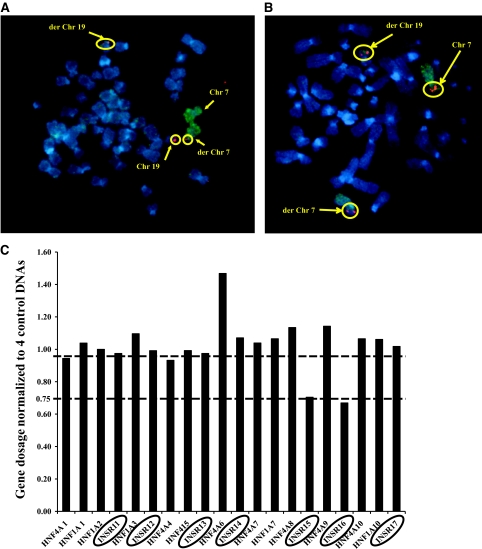
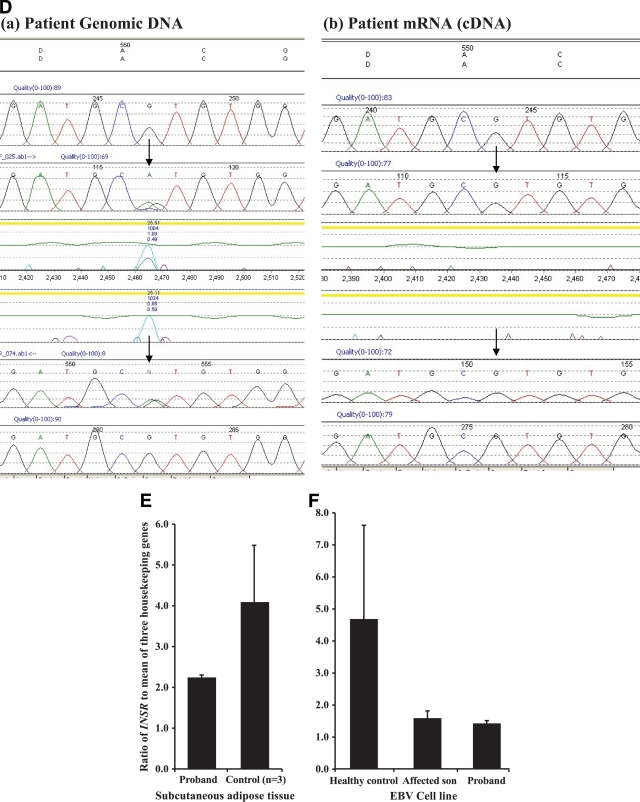
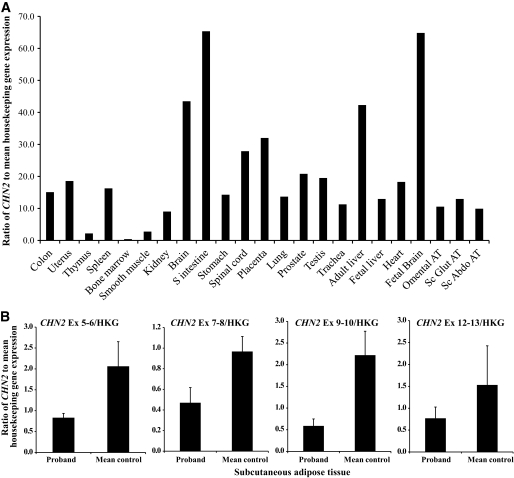
Research design and methods: Breakpoint mapping was performed by fluorescence in situ hybridization (FISH) on patient chromosomes. Sequencing and gene expression studies of disrupted and adjacent genes were performed on patient-derived tissues. RESULTS Affected individuals had increased insulin, C-peptide, insulin-to-C-peptide ratio, and adiponectin levels consistent with an insulin receptoropathy. FISH mapping established that the translocation breakpoints disrupt INSR on chromosome 19p15.2 and CHN2 on chromosome 7p13.2. Sequencing demonstrated INSR haploinsufficiency accounting for elevated insulin levels and dysglycemia. CHN2 encoding beta-2 chimerin was shown to be expressed in insulin-sensitive tissues, and its disruption was shown to result in decreased gene expression in patient-derived adipose tissue.

Conclusions: We present a likely digenic cause of insulin resistance and growth deficiency resulting from the combined heterozygous disruption of INSR and CHN2, implicating CHN2 for the first time as a key element of proximal insulin signaling in vivo.


Figures

FIG. 1.
FIG. 1.
A: Map of the INSR region on chromosome 19p13.2 illustrating the BACs and fosmids selected for FISH analysis. BACs (∼150–200 Kb in size) and fosmids (∼40 Kb in size) overlapping over the entire genomic sequence of INSR were selected and obtained for FISH analysis. Also shown are the results of FISH analysis, which demonstrated that the minimal breakpoint region is 10.8 Kb and all within the genomic sequence of INSR. B: Map of the CHN2 region on chromosome 7p15.1 illustrating the BACs and fosmids selected for FISH analysis. BACs (∼150–200 Kb in size) and fosmids (∼40 Kb in size) overlapping the entire genomic sequence of CHN2 were selected and obtained for FISH analysis. Also shown are the results of FISH analysis, which demonstrated that the minimal breakpoint region is 25.3 Kb and all within the genomic sequence of CHN2.
FIG. 2.
FIG. 2.
A: FISH analysis showing disruption of the BAC CTD-2560C1 containing the genomic sequence of INSR. As shown, the digoxigenein-labeled BAC CTD−2560C1 (red) spans the breakpoint as there are three signals apparent where it hybridizes to chromosome 19, derivative chromosome 19, and derivative chromosome 7. The two chromosome 7 homologs are identified by a fluoroisothiocyanate (FITC)-labeled chromosome-specific paint (green). Chromosomes are counterstained with DAPI (blue). B: FISH analysis showing disruption of the BAC RP11-980H8 containing the genomic sequence of CHN2. As shown, the digoxigenein-labeled BAC RP11-980H8 (red) spans the breakpoint with three signals apparent where it hybridizes to chromosome 7, derivative chromosome 7, and derivative chromosome 19. The two chromosome 7 homologs are identified by a FITC-labeled chromosome-specific paint (green). Chromosomes are counterstained with DAPI (blue). C: Identification of a cryptic microdeletion (exons 15–16) within INSR using MLPA. Graph of normalized gene dosage of INSR exons 11–17 and control HNF1A and HNF4A exons run at the same time. Dosage quotients were calculated from average crossing points of triplicate samples using the comparative Ct (ΔΔCt) method. A ratio of 1 implies normal gene dosage, and a ratio below 0.75 suggests a deletion. Exons 15 and 16 of INSR are deleted with a ratio of less than 0.75. D: Demonstration of monoallelic expression of INSR in a patient-derived lymphoblastoid cell line. The exon 8 silent variant, c.1650G>A, p.A550A, is heterozygous in genomic DNA, but sequencing of patient cDNA reveals monoallelic expression due to the heterozygous SNP only showing one allele at c.1650G. E: INSR gene expression studies in the proband's subcutaneous adipose tissue–derived cDNA showed reduced expression compared with that from three BMI-matched samples. F: INSR gene expression studies in patient EBV cell line–derived cDNA showed reduced expression in both the proband and her affected son compared with a healthy control sample. (A high-quality color digital representation of this figure is available in the online issue.)
FIG. 2.
FIG. 2.
A: FISH analysis showing disruption of the BAC CTD-2560C1 containing the genomic sequence of INSR. As shown, the digoxigenein-labeled BAC CTD−2560C1 (red) spans the breakpoint as there are three signals apparent where it hybridizes to chromosome 19, derivative chromosome 19, and derivative chromosome 7. The two chromosome 7 homologs are identified by a fluoroisothiocyanate (FITC)-labeled chromosome-specific paint (green). Chromosomes are counterstained with DAPI (blue). B: FISH analysis showing disruption of the BAC RP11-980H8 containing the genomic sequence of CHN2. As shown, the digoxigenein-labeled BAC RP11-980H8 (red) spans the breakpoint with three signals apparent where it hybridizes to chromosome 7, derivative chromosome 7, and derivative chromosome 19. The two chromosome 7 homologs are identified by a FITC-labeled chromosome-specific paint (green). Chromosomes are counterstained with DAPI (blue). C: Identification of a cryptic microdeletion (exons 15–16) within INSR using MLPA. Graph of normalized gene dosage of INSR exons 11–17 and control HNF1A and HNF4A exons run at the same time. Dosage quotients were calculated from average crossing points of triplicate samples using the comparative Ct (ΔΔCt) method. A ratio of 1 implies normal gene dosage, and a ratio below 0.75 suggests a deletion. Exons 15 and 16 of INSR are deleted with a ratio of less than 0.75. D: Demonstration of monoallelic expression of INSR in a patient-derived lymphoblastoid cell line. The exon 8 silent variant, c.1650G>A, p.A550A, is heterozygous in genomic DNA, but sequencing of patient cDNA reveals monoallelic expression due to the heterozygous SNP only showing one allele at c.1650G. E: INSR gene expression studies in the proband's subcutaneous adipose tissue–derived cDNA showed reduced expression compared with that from three BMI-matched samples. F: INSR gene expression studies in patient EBV cell line–derived cDNA showed reduced expression in both the proband and her affected son compared with a healthy control sample. (A high-quality color digital representation of this figure is available in the online issue.)
FIG. 3.
FIG. 3.
A: Expression profile of CHN2 in a panel of healthy human tissues to identify tissue distribution, shown is the expression in brain and insulin-sensitive tissues. The ratio of CHN2 expression relative to the mean of three housekeeping genes (PPIA, GAPDH, and 18s) was analyzed in a panel of human tissues. B: CHN2 expression is reduced in patient adipose tissue–derived cDNA compared with that of three matched healthy control samples. Gene expression studies to identify the expression levels of CHN2 (relative to the mean of three housekeeping genes) were performed using a combination of inventoried and designed assays to cover all known transcripts of CHN2. All transcripts of CHN2 were reduced in patient subcutaneous (SC) adipose tissue (AT) compared with those of three healthy control subjects (mean control).

Similar articles

Cited by

References

    1. Savage DB, Agostini M, Barroso I, Gurnell M, Luan J, Meirhaeghe A, Harding AH, Ihrke G, Rajanayagam O, Soos MA, George S, Berger D, Thomas EL, Bell JD, Meeran K, Ross RJ, Vidal-Puig A, Wareham NJ, O'Rahilly S, Chatterjee VK, Schafer AJ: Digenic inheritance of severe insulin resistance in a human pedigree. Nat Genet 2002; 31: 379– 384 - PubMed
    1. Taniguchi CM, Emanuelli B, Kahn CR: Critical nodes in signaling pathways: insights into insulin action. Nat Rev Mol Cell Biol 2006; 7: 85– 96 - PubMed
    1. Kahn CR, Flier JS, Bar RS, Archer JA, Gorden P, Martin MM, Roth J: The syndromes of insulin resistance and acanthosis nigricans: insulin-receptor disorders in man. N Engl J Med 1976; 294: 739– 745 - PubMed
    1. Krook A, Brueton L, O'Rahilly S: Homozygous nonsense mutation in the insulin receptor gene in infant with leprechaunism. Lancet 1993; 342: 277– 278 - PubMed
    1. Longo N, Wang Y, Smith SA, Langley SD, DiMeglio LA, Giannella-Neto D: Genotype-phenotype correlation in inherited severe insulin resistance. Hum Mol Genet 2002; 11: 1465– 1475 - PubMed

Publication types

MeSH terms