. 2009 Sep 15;106(37):15819-24.
doi: 10.1073/pnas.0901216106. Epub 2009 Aug 31.

miR-147, a microRNA that is induced upon Toll-like receptor stimulation, regulates murine macrophage inflammatory responses

Affiliations

miR-147, a microRNA that is induced upon Toll-like receptor stimulation, regulates murine macrophage inflammatory responses

Gang Liu et al. Proc Natl Acad Sci U S A. .

Abstract

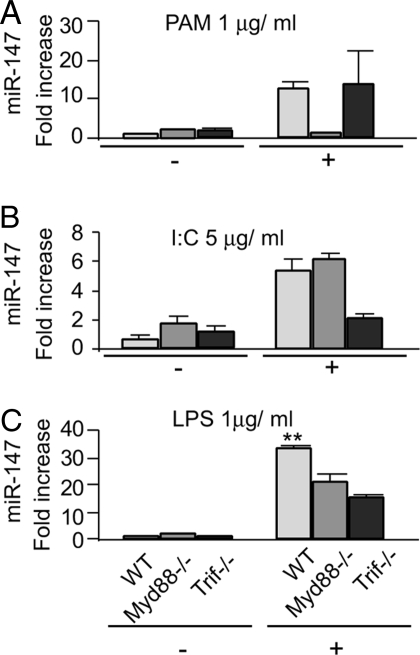
Toll-like receptors (TLRs) are major receptors that enable inflammatory cells to recognize invading microbial pathogens. MicroRNAs are small non-coding RNAs that play important regulatory roles in a variety of biological processes. In this study, we found that a microRNA, miR-147, was induced upon stimulation of multiple TLRs and functioned as a negative regulator of TLR-associated signaling events in murine macrophages. We first demonstrated that the NMES1 transcript was a functional primary miR-147. miR-147 was induced in LPS-stimulated mouse macrophages and under in vivo conditions in the lungs of LPS-treated mice. Expression of miR-147 was greater after cellular activation by TLR4 than after engagement of either TLR2 or TLR3, suggesting that maximal induction of miR-147 required activation of both NF-kappaB and IRF3. TLR4-induced miR-147 expression was both MyD88- and TRIF-dependent. The miR-147 promoter was responsive to TLR4 stimulation and both NF-kappaB and STAT1alpha bound to the miR-147 promoter. miR-147 mimics or induced expression of miR-147 decreased, whereas miR-147 knockdown increased inflammatory cytokine expression in macrophages stimulated with ligands to TLR2, TLR3, and TLR4. These data demonstrate a negative-feedback loop in which TLR stimulation induces miR-147 to prevent excessive inflammatory responses.


Conflict of interest statement

The authors declare no conflict of interest.

Figures

Fig. 1.
Fig. 1.
miR-147 is derived from the NMES1 gene transcripts. (A) Schematic representation of the miR-147/NMES1 gene. (B) Full-length NMES1 cDNA gives rise to mature miR-147. HEK-293 cells were transiently transfected with pBabe-H1, pBabe-H1-miR-147, pcDNA4, or pcDNA-4-NMES1. Twenty-four hours after transfection, the cells were collected and RNA was purified. Ten micrograms RNA from each sample was resolved on denatured PAGE gels. As a positive control, the indicated amounts of synthetic miR-147 mimics were loaded onto the same gel. Northern blotting was performed with specific miR-147 probes. The PAGE gel was prestained with ethidium bromide to determine an equal loading of RNA. (C) RAW264.7-miR-147 cells were un-induced or induced to express miR-147 for 1 day. The cells were collected and RNA purified. Northern blotting was performed as in (B).
Fig. 2.
Fig. 2.
miR-147 is up-regulated in LPS-treated macrophages. (A and B) Time course of mature (A) and primary miR-147 (B) induction after LPS stimulation. Peritoneal macrophages were treated with 1 μg/ml LPS for the indicated lengths of time. Real-time PCR was performed as described in Materials and Methods. The non-treated cells were used as controls and values from these cells were regarded as 1. Values are expressed as mean ± SD from triplicate wells. Data shown are representative of three experiments. (C and D) LPS dose-dependently induced miR-147 expression. Peritoneal macrophages were treated with LPS at the indicated concentrations for 24 h. Real-time PCR was performed to determine the expression of mature (C) and primary miR-147 (D). (E) Peritoneal macrophages were treated with LPS at the indicated concentrations for 24 h. RNA was purified and Northern blotting was performed with the miR-147 probes. The same membrane was re-blotted with U6 probes to ensure equal loading.
Fig. 3.
Fig. 3.
miR-147 is induced by stimulation of multiple TLRs. (A) Dose-dependent induction of miR-147 by poly(I:C) and LPS. Peritoneal macrophages were treated with PAM3CSK4, poly(I:C) or LPS at the indicated concentrations for 6 h (PAM3CSK4 and LPS) or 9 h (poly(I:C)). Real-time PCR was performed. Values are presented as mean ± SD from triplicate wells. ###, P < 0.001 compared to cells treated with 10 μg/mL PAM3CSK4. ***, P < 0.001 when compared to cells treated with 50 μg/mL poly(I:C). (B) LPS treatment rapidly induces IFN β expression. Peritoneal macrophages were treated with 1 μg/mL LPS for 0, 30, 60, and 120 min. The expression of IFN β was determined by real-time PCR analysis. (C and D) LPS-induced miR-147 expression requires de novo protein synthesis. Peritoneal macrophages were pretreated with or without 5 μg/mL cycloheximide (CHX) for 1 h. CHX was then removed and the cells were cultured with or without 1 μg/mL LPS for 3 h. Real-time PCR was performed to determine the levels of pri-mir-147 (C) and IL-1β (D). Values are presented as mean ± SD from four wells. *, P < 0.05 compared to cells treated with LPS alone. (E) Poly(I:C), but not PAM3CSK4-induced miR-147 expression requires de novo protein synthesis. Peritoneal macrophages were treated as in (C), except replacing LPS with 1 μg/mL PAM3CSK4 or 5 μg/mL poly(I:C).
Fig. 4.
Fig. 4.
TLR4 induced miR-147 expression requires both MyD88 and TRIF. (A–C) Peritoneal macrophages were isolated from WT, MyD88−/−, and TRIF−/− mice. The cells were treated with 1 μg/mL PAM3CSK4 (A), 5 μg/mL poly(I:C) (B), or 1 μg/mL LPS (C) for 0 or 6 h. Real-time PCR was performed to determine the levels of miR-147. Values are presented as mean ± SD from triplicate wells. **, P < 0.01 compared to MyD88−/− or TRIF−/− macrophages.
Fig. 5.
Fig. 5.
The miR-147 promoter is responsive to LPS stimulation. (A) Schematic representation of the miR-147 promoter, the locations of various transcriptional factor binding sites, the luciferase reporters containing the 2-kb miR-147 promoter and reporters with various deletions. (B) The miR-147 promoter is responsive to LPS stimulation. The luciferase reporters (0.2 μg) were transfected into RAW264.7 cells, and 24 h after transfection, the cells were cultured without or with 1 μg/ml LPS for an additional 16 h. Luciferase activities were determined and normalized to the protein concentration of the lysates. Luciferase activity with the empty vector pGL2 was regarded as 1. Values are presented as mean ± SD from 3–4 wells. *, P < 0.05 compared to cells transfected with pGL2. (C) Mutant promoter with an internal deletion of the GAS element and the NF-κB binding site proximal to the transcriptional start site is responsive to LPS stimulation. Experiments were performed as in (B). *, P < 0.05 compared to cells transfected with FL. (D) NF-κB and STAT1α bind to the miR-147 promoter. RAW264.7 cells were treated with 1 μg/ml LPS for 0, 30, 60, and 120 min. The cell extracts were immunoprecipitated with anti-p65 or STAT1α Abs. Specific primers were used to amplify the promoter region (−789 to −596) containing the potential NF-κB binding site and the GAS element in the miR-147 promoter and the NF-κB binding site in the IκB-α promoter.
Fig. 6.
Fig. 6.
miR-147 is a negative regulator of macrophage inflammatory responses. (A–C) miR-147 mimics attenuate LPS, PAM3CSK4, and poly(I:C) induced inflammatory response in primary macrophages. Peritoneal macrophages were transfected with 40 nM control microRNA mimics or miR-147 mimics. At 48 h after transfection, the cells were cultured without or with 1 ng/mL LPS (A), 1 μg/mL PAM3CSK4 (B), or 5 μg/mL poly(I:C) (C) for 18 h. The levels of TNF-α and IL-6 in the supernatants were determined by ELISA. (D and E) miR-147 knockdown enhanced LPS and poly(I:C) induced IL-6 expression. Peritoneal macrophages were transfected with 40 nM control LNA knockdown probes or LNA miR-147 knockdown probes. At 48 h after transfection, the cells were cultured without or with 1 ng/mL LPS (D) or 5 μg/mL poly(I:C) (E) for 18 h. The levels of TNF-α and IL-6 in the supernatants were then determined. Values are presented as mean ± SD from triplicate wells. *, P < 0.05, **, P < 0.01, and ***, P < 0.001 compared to control groups.

References

    1. Akira S, Takeda K. Toll-like receptor signalling. Nat Rev Immunol. 2004;4:499–511. - PubMed
    1. Barton GM, Medzhitov R. Toll-like receptor signaling pathways. Science. 2003;300:1524–1525. - PubMed
    1. Bell JK, et al. Leucine-rich repeats and pathogen recognition in Toll-like receptors. Trends Immunol. 2003;24:528–533. - PubMed
    1. O'Neill LA. How Toll-like receptors signal: What we know and what we don't know. Curr Opin Immunol. 2006;18:3–9. - PubMed
    1. Moynagh PN. The NF-kappaB pathway. J Cell Sci. 2005;118:4589–4592. - PubMed

Publication types

MeSH terms

LinkOut - more resources