. 2009 Oct 29;114(18):3803-12.
doi: 10.1182/blood-2009-03-213595. Epub 2009 Aug 31.

Obesity accelerates thymic aging

Affiliations

Obesity accelerates thymic aging

Hyunwon Yang et al. Blood. .

Abstract

As the expanding obese population grows older, their successful immunologic aging will be critical to enhancing the health span. Obesity increases risk of infections and cancer, suggesting adverse effects on immune surveillance. Here, we report that obesity compromises the mechanisms regulating T-cell generation by inducing premature thymic involution. Diet-induced obesity reduced thymocyte counts and significantly increased apoptosis of developing T-cell populations. Obesity accelerated the age-related reduction of T-cell receptor (TCR) excision circle bearing peripheral lymphocytes, an index of recently generated T cells from thymus. Consistent with reduced thymopoiesis, dietary obesity led to reduction in peripheral naive T cells with increased frequency of effector-memory cells. Defects in thymopoiesis in obese mice were related with decrease in the lymphoid-primed multipotent progenitor (Lin-Sca1+Kit+ Flt3+) as well as common lymphoid progenitor (Lin-Sca1+CD117(lo)CD127+) pools. The TCR spectratyping analysis showed that obesity compromised V-beta TCR repertoire diversity. Furthermore, the obesity induced by melanocortin 4 receptor deficiency also constricted the T-cell repertoire diversity, recapitulating the thymic defects observed with diet-induced obesity. In middle-aged humans, progressive adiposity with or without type 2 diabetes also compromised thymic output. Collectively, these findings establish that obesity constricts T-cell diversity by accelerating age-related thymic involution.


Figures

Figure 1
Figure 1
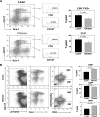
DIO induces thymic involution. (A) Compared with chow-fed control male mice, the thymus appeared “fatty” in age-matched 13-month-old DIO animals along with increased body weight and reduced total thymic cell numbers (n = 12 per group). (B) The hematoxylin and eosin–stained sections of 13-month-old control and DIO mice showed increased perithymic fat and obliteration of CMJ. (C) FACS analysis of CD4-FITC– and CD8-PE–stained thymocytes. The 13-month-old DIO mice had significant reduction in SP CD4 (bottom right quadrant) and CD8 (top left quadrant) and in double-positive cells (top right quadrant). (D) The annexin-V staining on CD4 SP and CD8 SP cells showed a statistically significant (P < .05) increase in the frequency of apoptosis. Data are expressed as mean ± SEM from 8 to 12 mice per group. Images were acquired using Zeiss Axioskope microscope (10× and 20× objectives) and Axiovision Rel 4.6 software.
Figure 2
Figure 2
Obesity decreases naive T cells and expands memory cells. Chow-fed control mice and mice fed a high-fat (60%) diet were evaluated for naive (CD62L+CD44; red box) E/M (CD62LCD44+) CD4 and CD8 T cells at 3 months (n = 10-12/group), 9 months (n = 8/group), and 13 months (n = 12/group) of age. Obesity significantly reduces naive cells (top left quadrant) and expands E/M splenic T cells (bottom right quadrant) in 9- and 13-month-old mice but not at 3 months of age.
Figure 3
Figure 3
DIO reduces thymopoiesis and restricts TCR diversity. (A) The splenic CD4+ T cells were isolated to prepare the DNA, and signal-joint TREC levels were analyzed by using quantitative PCR analysis. A total of 6 to 10 mice per group were used for sjTREC assay, and the data are expressed as mean ± SEM. The obesity in mice significantly reduced TRECs at all ages examined. (B) Real-time PCR analysis of cytokine mRNA expression in purified CD4 cells from 13-month-old control and DIO mice (n = 6/group). (C) The TCR spectratyping analyses of CD4 T cells from 3- and 9-month-old mice on chow and high-fat diets are shown (n = 5). A polyclonal profile is Gaussian with 6 to 8 peaks, whereas alterations from Gaussian distributions are measure of oligoclonality. The Gaussian distribution profiles were translated into probability distributions as functions of the AUC for each CDR3 length. The average distribution of the CD4+ repertoire from 3- and 9-month-old ad libitum–fed chow diet controls is compared with the DIO mice. The statistical quantitation of the CDR3 size of all the TCR Vβ between control and DIO mice was performed by using CDR3QAssay software. The extent of the change in the CDR3 size distribution is defined as the percentage of improvement (distance from the mean value). (The percentage of improvement greater than 3 SDs in the fragment length of each family indicates that there are significant changes in the Vβ family, based on Gorochov et al.) These improvements in TCR diversity are represented as landscape surfaces, in which smooth (blue) landscapes represent an unchanged TCR repertoire (diversity). The mountain (in green, yellow, and orange) depicts perturbation in amplified peaks of CDR3 lengths compared with control mice. Each line crossing on the y-axis of the landscape denotes perturbation for a specific CDR3 length or size (x-axis) of a particular Vβ family (z-axis).
Figure 4
Figure 4
Obesity reduces lymphoid pool and increases myeloid progenitors. (A) BM cells from femurs of control and DIO mice (13 months of age; n = 6/group) were stained for lineage markers, CD117, Sca1, and CD127. A representative dot plot show gating strategy (on Linlo cells) and Flt3 expression to define MPP (Flt3+LSK) and CLPs (LinSca1+CD117loCD127+) with CD127 expression depicted as histogram. (B) Flow cytometry analyses of BM cells from 13-month-old control and DIO mice. Obesity increases the subsets of CMPs (LinCD127CD117hiSca1 CD34+CD16CD32) and MEPs (LinCD127CD117hiSca1CD34CD16CD32) and significantly reduced (P < .05) GMPs (LinCD127CD117hiSca1CD34+CD16CD32+).
Figure 5
Figure 5
Deficient Mc4r signaling–driven obesity accelerates thymic involution. The WT and Mc4r knockout mice were maintained on an ad libitum chow diet and aged for 8 months. (A) The real-time PCR analysis of Mc4r mRNA in 2- to 3-month-old C57BL/6 mice (n = 3). The total RNA from cells and tissues was DNAse digested, and RT-PCR analysis shows the CNS-restricted expression of Mc4r. (B) Obesity mediated by Mc4r deficiency causes thymic adiposity. Thymus is highlighted in blue box and arrows, compared with control WT mice; inset shows malformed fatty thymus in Mc4r−/− animals. (C-D) Compared with WT mice, loss of Mc4r significantly (P < .05) reduces the frequency of CD4 and CD8 naive (CD62L+CD44) T cells (top left quadrant) and (E) decreases sjTREC numbers in splenic CD4 cells. (F,H) Mc4r deficiency–driven obesity significantly reduces the ETP (LinloCD44+ckithi) cells in thymus and (G-H) LSK cells in BM (n = 5 per group; top right quadrant).
Figure 6
Figure 6
Mc4r-mediated adiposity induces premature restriction of TCR diversity. (A) The TCR spectratyping analysis of CD4 T cells from control and Mc4r-null mice is shown. The x-axis shows CDR3 lengths, and each line crossing on the y-axis of the landscape denotes perturbation for a specific CDR3 size (x-axis), whereas individual Vβ are shown on the z-axis. The mountain (in green, yellow, and orange) depicts perturbation in amplified peaks of CDR3 lengths of MC4R−/− animals in comparison to WT mice (n = 5). (B) Representative Vβ results of CDR3 size spectratyping in WT and Mc4r-null mice.
Figure 7
Figure 7
Obesity in humans reduces thymopoiesis. (A) Obesity in humans reduces thymopoiesis, quantitative PCR analysis of human sjTRECs in PBMCs shows significant correlation between reduction in TRECs with increasing BMI (30-40 years old). (B) The frozen PBMCs from additional (male and female; n = 30-35; age, 30-45 years) lean subjects were analyzed for TRECs and compared with overweight and obese subjects with and without T2D. All morbid obese (BMI > 45) subjects were insulin resistant.

References

    1. Barger JL, Walford RL, Weindruch R. The retardation of aging by caloric restriction: its significance in the transgenic era. Exp Gerontol. 2003;38(11):1343–1351. - PubMed
    1. Nikolich-Zugich J, Messaoudi I. Mice and flies and monkeys too: caloric restriction rejuvenates the aging immune system of non-human primates. Exp Gerontol. 2005;40(11):884–893. - PubMed
    1. Yang H, Youm H, Dixit VD. Inhibition of thymic adipogenesis by caloric restriction is coupled with reduction in age-related thymic involution. J Immunol. 2009;183(5):3040–3052. - PMC - PubMed
    1. Dixit VD. Adipose-immune interactions during obesity and caloric restriction: reciprocal mechanisms regulating immunity and health span. J Leukoc Biol. 2008;84(4):882–892. - PMC - PubMed
    1. Linton PJ, Dorshkind K. Age-related changes in lymphocyte development and function. Nat Immunol. 2004;5(2):133–139. - PubMed

Publication types

MeSH terms

Substances