. 2009 Sep;6(9):e1000139.
doi: 10.1371/journal.pmed.1000139. Epub 2009 Sep 1.

The impact of the demographic transition on dengue in Thailand: insights from a statistical analysis and mathematical modeling

Affiliations

The impact of the demographic transition on dengue in Thailand: insights from a statistical analysis and mathematical modeling

Derek A T Cummings et al. PLoS Med. 2009 Sep.

Abstract

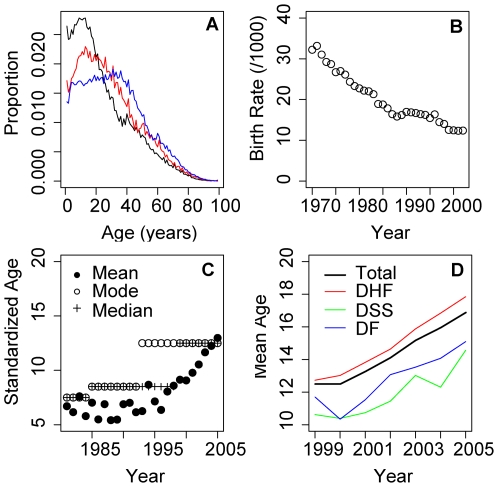
Background: An increase in the average age of dengue hemorrhagic fever (DHF) cases has been reported in Thailand. The cause of this increase is not known. Possible explanations include a reduction in transmission due to declining mosquito populations, declining contact between human and mosquito, and changes in reporting. We propose that a demographic shift toward lower birth and death rates has reduced dengue transmission and lengthened the interval between large epidemics.

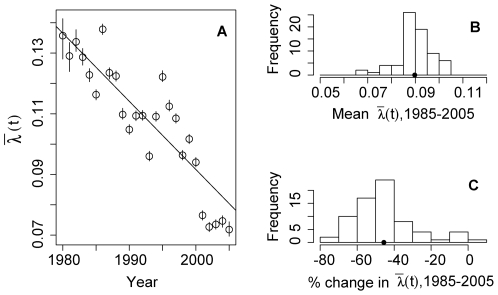
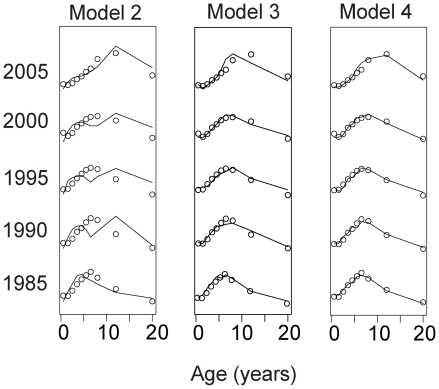
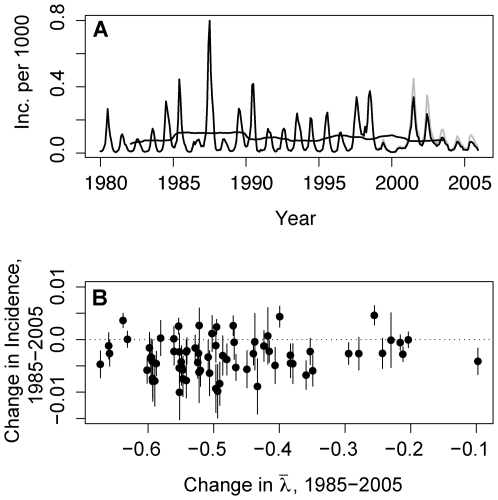
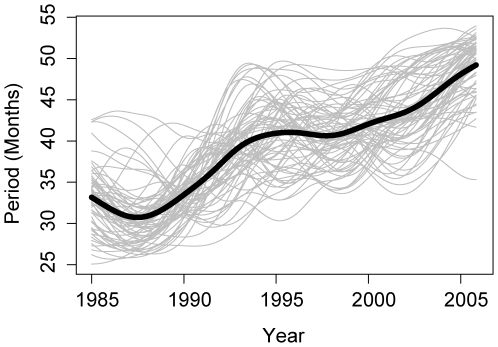
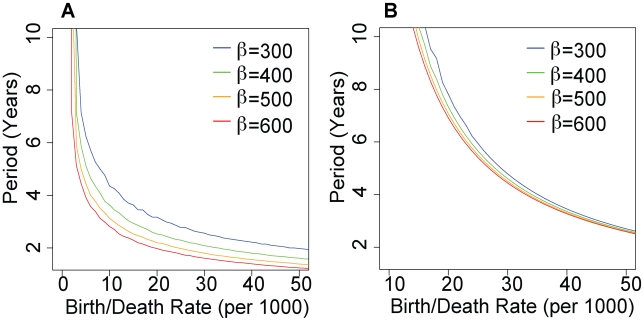
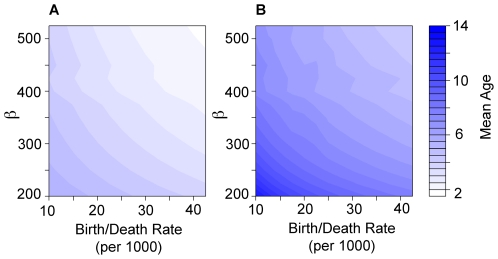
Methods and findings: Using data from each of the 72 provinces of Thailand, we looked for associations between force of infection (a measure of hazard, defined as the rate per capita at which susceptible individuals become infected) and demographic and climactic variables. We estimated the force of infection from the age distribution of cases from 1985 to 2005. We find that the force of infection has declined by 2% each year since a peak in the late 1970s and early 1980s. Contrary to recent findings suggesting that the incidence of DHF has increased in Thailand, we find a small but statistically significant decline in DHF incidence since 1985 in a majority of provinces. The strongest predictor of the change in force of infection and the mean force of infection is the median age of the population. Using mathematical simulations of dengue transmission we show that a reduced birth rate and a shift in the population's age structure can explain the shift in the age distribution of cases, reduction of the force of infection, and increase in the periodicity of multiannual oscillations of DHF incidence in the absence of other changes.

Conclusions: Lower birth and death rates decrease the flow of susceptible individuals into the population and increase the longevity of immune individuals. The increase in the proportion of the population that is immune increases the likelihood that an infectious mosquito will feed on an immune individual, reducing the force of infection. Though the force of infection has decreased by half, we find that the critical vaccination fraction has not changed significantly, declining from an average of 85% to 80%. Clinical guidelines should consider the impact of continued increases in the age of dengue cases in Thailand. Countries in the region lagging behind Thailand in the demographic transition may experience the same increase as their population ages. The impact of demographic changes on the force of infection has been hypothesized for other diseases, but, to our knowledge, this is the first observation of this phenomenon. Please see later in the article for the Editors' Summary.


Conflict of interest statement

The authors have declared that no competing interests exist.

Figures

Figure 1
Figure 1. Demographic changes in Thailand and changes in the age distribution of dengue illness.
(A) Age structure of the Thai population 1980 (black), 1990 (red), and 2000 (blue). (B) Birth rates per 1,000 individuals 1970–2000. (C) Mean, median, and modal age of age-standardized dengue incidence data in Thailand 1981–2005. Age-specific incidence in all years was standardized to age distribution of Thailand's population in 2000 using direct age adjustment. Mean (filled circles), mode (unfilled circles), and median (plus sign) age of standardized age-specific incidence of dengue disease reported to the national surveillance system for each year are shown. (D) Mean age of DHF (red), DSS (green), DF cases (blue), and total (black) cases reported to the national surveillance system 1999–2005.
Figure 2
Figure 2. The force of infection of dengue in Thailand, 1980–2005.
(A) Estimates of the force of infection (per year) for each year, 1980–2005 in Thailand estimated using age-specific case data aggregated at the national level and model 3 (see Text S1). 95% CIs are indicated by vertical bars. The line drawn is the least squares linear regression weighted using the reciprocal of width of CIs on each point. This linear trend shows a reduction in the force of infection of 0.002 per year (p<1e−6). (B) Histogram of mean forces of infection averaged over the interval 1985–2005 estimated using data from each of the 72 provinces of Thailand. Histogram shows the frequency of 72 estimates occurring in the ranges indicated on the x-axis. (C) Histogram of changes in forces of infection over the interval 1985–2005 estimated using data from each of the 72 provinces of Thailand. Histogram shows the frequency of 72 estimates of the change in force of infection occurring in the ranges indicated on the x-axis. We estimated changes using weighted least squares regression of annual estimates of the force of infection in each location.
Figure 3
Figure 3. Fit of models to data 1985, 1990, 1995, 2000, 2005, model 2, 3, and 4.
Age-specific incidence is shown by circles and fits from model shown by lines. Model 2 includes time-specific but not age-specific forces of infection. Model 3 includes additive age-specific forces of infection in addition to time-specific forces. Model 4 includes multiplicative age-specific forces of infection in addition to time-specific forces.
Figure 4
Figure 4. Incidence of dengue disease in Thailand, 1981–2005.
(A) Incidence of dengue disease in Thailand, 1981–2005. The solid line shows the incidence per 1,000 individuals per year of DHF and DSS together, whereas the grey line shows the incidence of DHF, DSS, and DF. DF was included in case reports starting in 1993. (B) Change in incidence (per 1,000 per year) 1985–2005 with 95% CI versus change in force of infection for each of the provinces of Thailand. A linear association between these two variables is not statistically significant.
Figure 5
Figure 5. Period of multiannual oscillations of DHF incidence in each of the 72 provinces of Thailand.
Each line is the period in months of the incidence in one province. Period presented is the mean period of power in a period band of 18 to 60 mo reconstructed using the continuous wavelet transform (see Text S1, Detailed Methods). The thick line shows the period of multiannual oscillations of country-wide incidence.
Figure 6
Figure 6. Period of multiannual oscillations of a four-serotype dengue transmission model.
(A) Simulations include immune enhancement of transmission (second infections are 1.85 times as transmissible as primary infections) . (B) Simulations including no immune enhancement but including seasonality in transmission coefficient (peak coefficients exceed mean coefficients by 4%). Period is plotted as a function of birth/death rate for simulations in which the transmission coefficient, β is 300 (blue), 400 (green), 500 (orange), and 600 (red).
Figure 7
Figure 7. Results of an age-specific deterministic transmission model.
Average age of (A) primary dengue and (B) secondary dengue cases in a two-serotype transmission model. In both plots, age is indicated by the color blue with legend at right. The birth and death rate varies from 10 per 1,000 to 40 per 1,000 and the transmission coefficient varies from 200 to 500 (R 0≈4–10). The average ages of both primary and secondary cases rise with decreasing birth/death rate and decreasing transmission coefficient. The average age of secondary cases rises faster with each unit decrease in birth/death rates (range of average ages in (B), 4–16 y, range of average ages in (A) 2–5 y.

Comment in

Similar articles

Cited by

References

    1. Kongsomboon K, Singhasivanon P, Kaewkungwal J, Nimmannitya S, Mammen MP, Jr, et al. Temporal trends of dengue fever/dengue hemorrhagic fever in Bangkok, Thailand from 1981 to 2000: an age-period-cohort analysis. Southeast Asian J Trop Med Public Health. 2004;35:913–917. - PubMed
    1. Halstead SB. More dengue, more questions. Emerg Infect Dis. 2005;11:740–741. - PMC - PubMed
    1. Malavige GN, Velathanthiri VG, Wijewickrama ES, Fernando S, Jayaratne SD, et al. Patterns of disease among adults hospitalized with dengue infections. QJM. 2006;99:299–305. - PubMed
    1. Thai KT, Binh TQ, Giao PT, Phuong HL, Hung lQ, et al. Seroprevalence of dengue antibodies, annual incidence and risk factors among children in southern Vietnam. Trop Med Int Health. 2005;10:379–386. - PubMed
    1. Wichmann O, Hongsiriwon S, Bowonwatanuwong C, Chotivanich K, Sukthana Y, et al. Risk factors and clinical features associated with severe dengue infection in adults and children during the 2001 epidemic in Chonburi, Thailand. Trop Med Int Health. 2004;9:1022–1029. - PubMed

Publication types