

Depressive symptoms and brain volumes in older adults: a longitudinal magnetic resonance imaging study
- PMID: 19721847
- PMCID: PMC2732743
Depressive symptoms and brain volumes in older adults: a longitudinal magnetic resonance imaging study
Abstract
Background: Late-life depression is associated with decreased brain volumes, particularly in frontal and temporal areas. Evidence suggests that depressive symptoms at a subclinical level are also associated with brain atrophy in these regions, but most of these associations are based on cross-sectional data. Our objective was to investigate both cross-sectional and longitudinal relations between sub-threshold depressive symptoms and brain volumes in older adults and to examine whether these associations are modified by age.
Methods: In total, 110 dementia-free adults from the neuroimaging substudy of the Baltimore Longitudinal Study of Aging aged 56 years and older at baseline participated in this study. Participants received annual evaluations for up to 9 years, during which structural magnetic resonance imaging (MRI) scans were acquired and depressive symptoms were measured using the Center for Epidemiologic Studies Depression Scale.
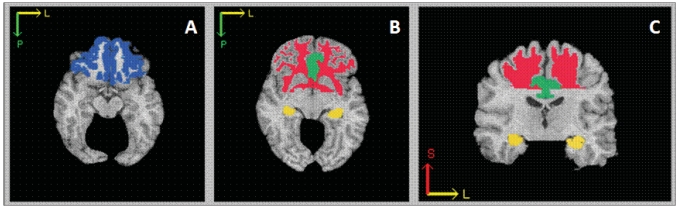
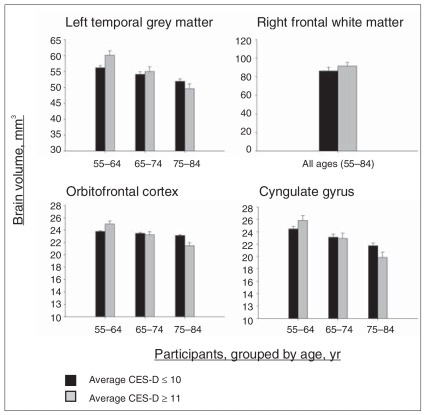
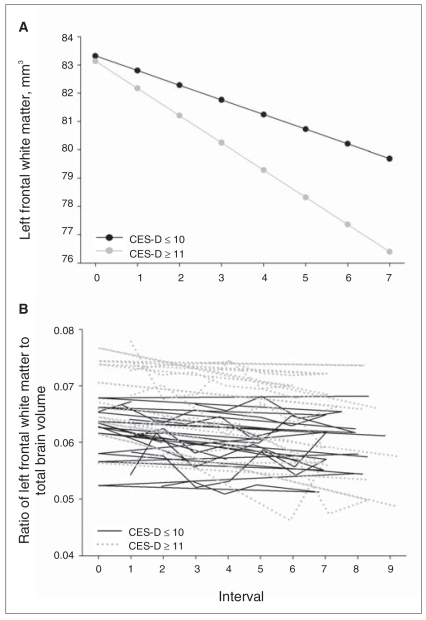
Results: Mean depressive symptom scores over time were associated with grey matter volume reductions in the left temporal lobe. Depressive symptoms were associated with brain volume reductions with advancing age in the cingulate gyrus and orbitofrontal cortex. Moreover, individuals with higher mean depressive symptom scores showed a faster rate of volume decline in left frontal white matter. Depressive symptoms were not associated with hippocampus volumes.
Limitations: Limitations include the relative homogeneity of our primarily white and highly educated sample, the lack of information about age at onset of depressive symptoms and potential limitations of the automated brain volume registration.
Conclusion: Our results suggest that depressive symptoms, even at a subthreshold level, are associated with volume reductions in specific frontal and temporal brain regions, particularly with advancing age.
Figures
References
-
- Beck DA, Koenig HG. Minor depression: a review of the literature. Int J Psychiatry Med. 1996;26:177–209. - PubMed
-
- Blazer DG. Depression in late life: review and commentary. J Gerontol A Biol Sci Med Sci. 2003;58:249–65. - PubMed
-
- Girling DM, Huppert FA, Brayne C, et al. Depressive symptoms in the very elderly–their prevalence and significance. Int J Geriatr Psychiatry. 1995;10:497–504.
-
- Lavretsky H, Kumar A. Clinically significant non-major depression: old concepts, new insights. Am J Geriatr Psychiatry. 2002;10:239–55. - PubMed
-
- Lyness JM, King DA, Cox C, et al. The importance of subsyndromal depression in older primary care patients: prevalence and associated functional disability. J Am Geriatr Soc. 1999;47:647–52. - PubMed
Publication types
MeSH terms
Substances
Grants and funding
LinkOut - more resources
Full Text Sources
Medical