

Adipose triglyceride lipase deficiency causes tissue-specific changes in insulin signaling
- PMID: 19723629
- PMCID: PMC2781577
- DOI: 10.1074/jbc.M109.047787
Adipose triglyceride lipase deficiency causes tissue-specific changes in insulin signaling
Abstract
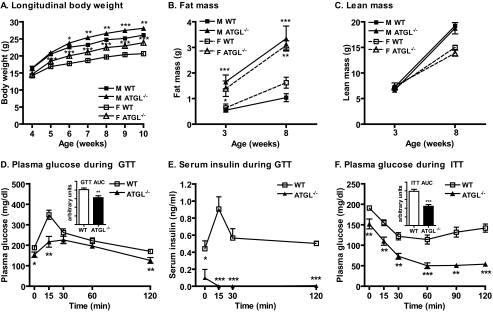
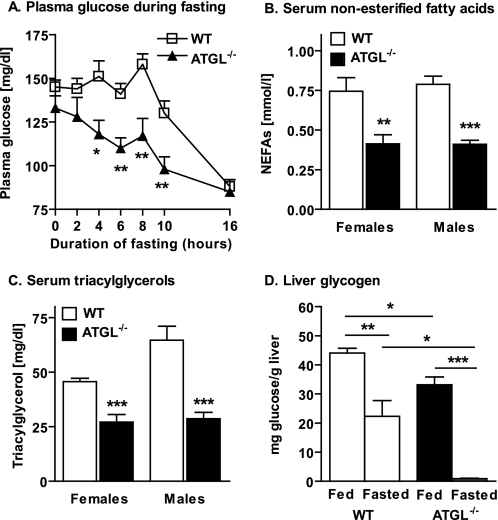
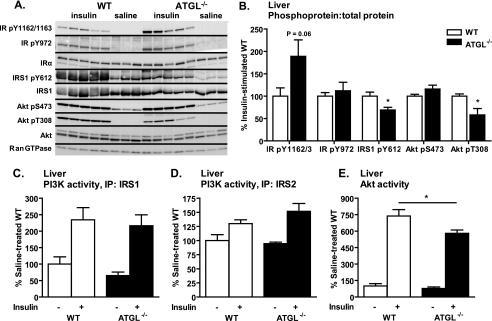
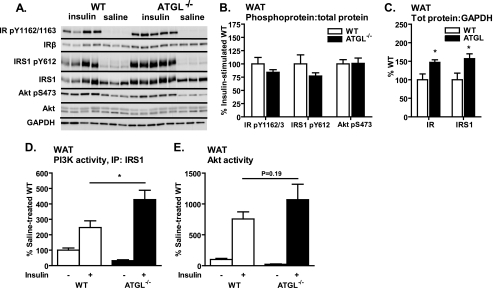
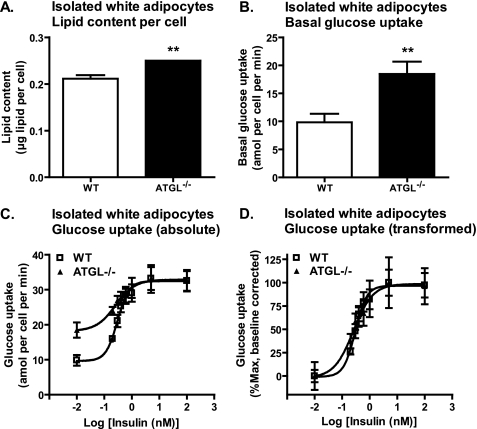
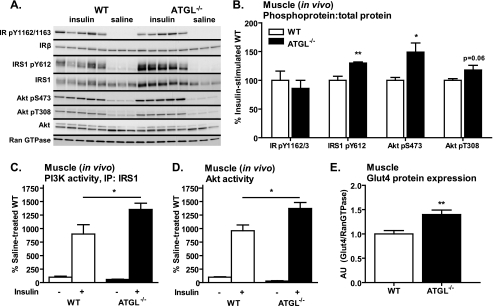
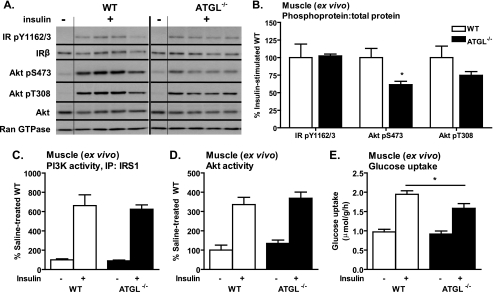
Triacylglycerol accumulation in insulin target tissues is associated with insulin resistance. Paradoxically, mice with global targeted deletion of adipose triglyceride lipase (ATGL), the rate-limiting enzyme in triacylglycerol hydrolysis, display improved glucose tolerance and insulin sensitivity despite triacylglycerol accumulation in multiple tissues. To determine the molecular mechanisms for this phenotype, ATGL-deficient (ATGL(-/-)) and wild-type mice were injected with saline or insulin (10 units/kg, intraperitoneally), and then phosphorylation and activities of key insulin-signaling proteins were determined in insulin target tissues (liver, adipose tissue, and muscle). Insulin signaling and/or glucose transport was also evaluated in isolated adipocytes and skeletal muscle ex vivo. In ATGL(-/-) mice, insulin-stimulated phosphatidylinositol 3-kinase and Akt activities as well as phosphorylation of critical residues of IRS1 (Tyr(P)-612) and Akt (Ser(P)-473) were increased in skeletal muscle in vivo. Insulin-stimulated phosphatidylinositol 3-kinase activity and total insulin receptor and insulin receptor substrate 1, but not other parameters, were also increased in white adipose tissue in vivo. In contrast, in vivo measures of insulin signaling were decreased in brown adipose tissue and liver. Interestingly, the enhanced components of insulin signaling identified in skeletal muscle and white adipose tissue in vivo and their expected downstream effects on glucose transport were not present ex vivo. ATGL deficiency altered intramyocellular lipids as well as serum factors known to influence insulin sensitivity. Thus, skeletal muscle, rather than other tissues, primarily contributes to enhanced insulin sensitivity in ATGL(-/-) mice in vivo despite triacylglycerol accumulation, and both local and systemic factors contribute to tissue-specific effects of global ATGL deficiency on insulin action.
Figures

Similar articles
-
The role of adipose triglyceride lipase in lipid and glucose homeostasis: lessons from transgenic mice.Lipids Health Dis. 2019 Nov 22;18(1):204. doi: 10.1186/s12944-019-1151-z. Lipids Health Dis. 2019. PMID: 31757217 Free PMC article. Review.
-
Skeletal muscle triacylglycerol hydrolysis does not influence metabolic complications of obesity.Diabetes. 2013 Oct;62(10):3350-61. doi: 10.2337/db13-0500. Epub 2013 Jul 8. Diabetes. 2013. PMID: 23835334 Free PMC article.
-
Adipose triglyceride lipase deletion from adipocytes, but not skeletal myocytes, impairs acute exercise performance in mice.Am J Physiol Endocrinol Metab. 2015 May 15;308(10):E879-90. doi: 10.1152/ajpendo.00530.2014. Epub 2015 Mar 17. Am J Physiol Endocrinol Metab. 2015. PMID: 25783895 Free PMC article.
-
High-fat diet-mediated lipotoxicity and insulin resistance is related to impaired lipase expression in mouse skeletal muscle.Endocrinology. 2013 Apr;154(4):1444-53. doi: 10.1210/en.2012-2029. Epub 2013 Mar 7. Endocrinology. 2013. PMID: 23471217
-
[Adipose triglyceride lipase regulates adipocyte lipolysis].Sheng Li Ke Xue Jin Zhan. 2008 Jan;39(1):10-4. Sheng Li Ke Xue Jin Zhan. 2008. PMID: 18357681 Review. Chinese.
Cited by
-
Effect of Bariatric Weight Loss on the Adipose Lipolytic Transcriptome in Obese Humans.Mediators Inflamm. 2015;2015:106237. doi: 10.1155/2015/106237. Epub 2015 Nov 18. Mediators Inflamm. 2015. PMID: 26663986 Free PMC article.
-
Lipolysis-derived fatty acids are needed for homeostatic control of sterol element-binding protein-1c driven hepatic lipogenesis.Commun Biol. 2025 Apr 9;8(1):588. doi: 10.1038/s42003-025-08002-1. Commun Biol. 2025. PMID: 40205023 Free PMC article.
-
Lipolysis - a highly regulated multi-enzyme complex mediates the catabolism of cellular fat stores.Prog Lipid Res. 2011 Jan;50(1):14-27. doi: 10.1016/j.plipres.2010.10.004. Epub 2010 Nov 16. Prog Lipid Res. 2011. PMID: 21087632 Free PMC article. Review.
-
Hepatic ATGL knockdown uncouples glucose intolerance from liver TAG accumulation.FASEB J. 2013 Jan;27(1):313-21. doi: 10.1096/fj.12-213454. Epub 2012 Sep 19. FASEB J. 2013. PMID: 22993196 Free PMC article.
-
Early structural and metabolic cardiac remodelling in response to inducible adipose triglyceride lipase ablation.Cardiovasc Res. 2013 Aug 1;99(3):442-51. doi: 10.1093/cvr/cvt124. Epub 2013 May 25. Cardiovasc Res. 2013. PMID: 23708736 Free PMC article.
References
-
- Schaffer J. E. (2003) Curr. Opin. Lipidol. 14, 281–287 - PubMed
-
- Unger R. H. (2003) Endocrinology 144, 5159–5165 - PubMed
-
- van Herpen N. A., Schrauwen-Hinderling V. B. (2008) Physiol. Behav. 94, 231–241 - PubMed
-
- Goodpaster B. H., He J., Watkins S., Kelley D. E. (2001) J. Clin. Endocrinol. Metab. 86, 5755–5761 - PubMed
Publication types
MeSH terms
Substances
Grants and funding
- F 3001/FWF_/Austrian Science Fund FWF/Austria
- W 901/FWF_/Austrian Science Fund FWF/Austria
- P30-DK57521/DK/NIDDK NIH HHS/United States
- R03 DK077697/DK/NIDDK NIH HHS/United States
- Z 136/FWF_/Austrian Science Fund FWF/Austria
- R37-DK028082/DK/NIDDK NIH HHS/United States
- R37 DK028082/DK/NIDDK NIH HHS/United States
- R03-DK077697/DK/NIDDK NIH HHS/United States
- R01 DK043051/DK/NIDDK NIH HHS/United States
- DK043051/DK/NIDDK NIH HHS/United States
- F 3002/FWF_/Austrian Science Fund FWF/Austria
- K08-DK065833/DK/NIDDK NIH HHS/United States
- R37 DK043051/DK/NIDDK NIH HHS/United States
- K08 DK065833/DK/NIDDK NIH HHS/United States
- P30 DK057521/DK/NIDDK NIH HHS/United States
LinkOut - more resources
Full Text Sources
Other Literature Sources
Medical
Molecular Biology Databases
