. 2009 Sep 15;69(18):7412-21.
doi: 10.1158/0008-5472.CAN-09-0116. Epub 2009 Sep 1.

DNMT1 and DNMT3B modulate distinct polycomb-mediated histone modifications in colon cancer

Affiliations

DNMT1 and DNMT3B modulate distinct polycomb-mediated histone modifications in colon cancer

Bilian Jin et al. Cancer Res. .

Abstract

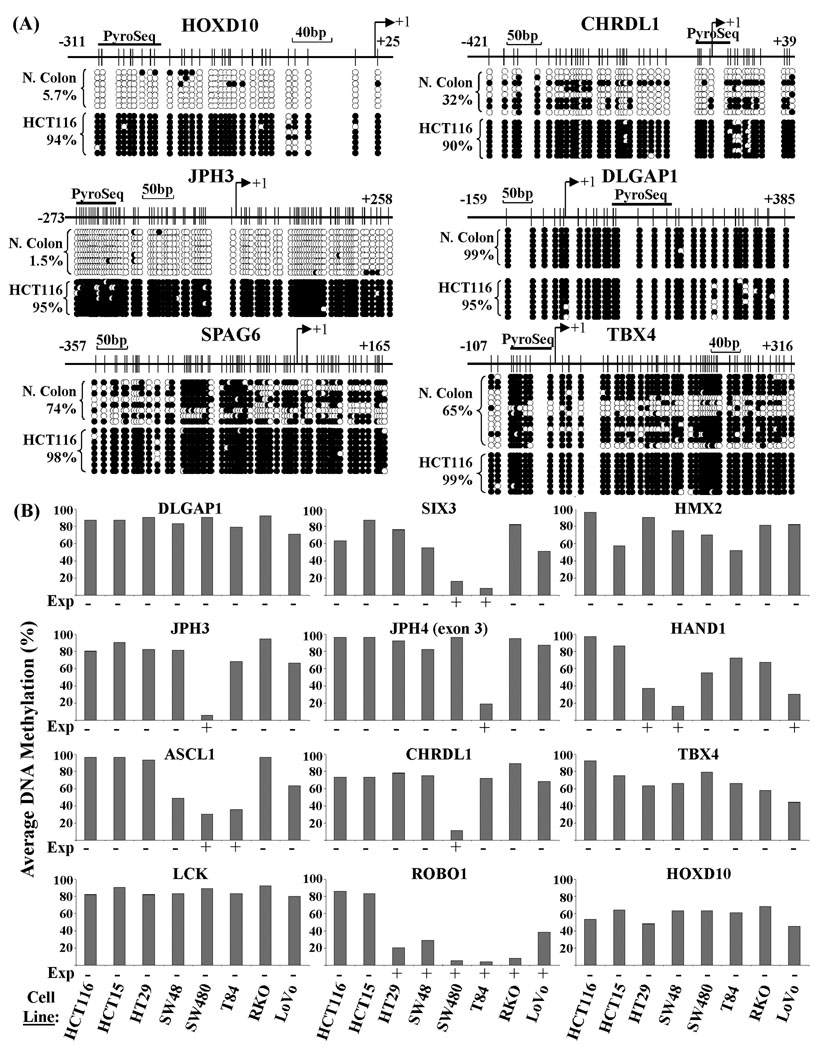
DNA methylation patterns are established and maintained by three DNA methyltransferases (DNMT): DNMT1, DNMT3A, and DNMT3B. Although essential for development, methylation patterns are frequently disrupted in cancer and contribute directly to carcinogenesis. Recent studies linking polycomb group repression complexes (PRC1 and PRC2) to the DNMTs have begun to shed light on how methylation is targeted. We identified previously a panel of genes regulated by DNMT3B. Here, we compare these with known polycomb group targets to show that approximately 47% of DNMT3B regulated genes are also bound by PRC1 or PRC2. We chose 44 genes coregulated by DNMT3B and PRC1/PRC2 to test whether these criteria would accurately identify novel targets of epigenetic silencing in colon cancer. Using reverse transcription-PCR, bisulfite genomic sequencing, and pyrosequencing, we show that the majority of these genes are frequently silenced in colorectal cancer cell lines and primary tumors. Some of these, including HAND1, HMX2, and SIX3, repressed cell growth. Finally, we analyzed the histone code, DNMT1, DNMT3B, and PRC2 binding by chromatin immunoprecipitation at epigenetically silenced genes to reveal a novel link between DNMT3B and the mark mediated by PRC1. Taken together, these studies suggest that patterns of epigenetic modifiers and the histone code influence the propensity of a gene to become hypermethylated in cancer and that DNMT3B plays an important role in regulating PRC1 function.


Figures

Fig. 1
Fig. 1
Relationship between genes regulated by DNMT3B and genes bound by PRC1 and PRC2. (A) Left. Venn diagram comparing the overlap between DNMT3B and PRC1/PRC2 target genes. Right. Table summarizing the percent overlap between DNMT3B, PRC1, and PRC2 along with results of our frequency of gene methylation in cancer predictive analysis. (B) Expression of forty-four DNMT3B+PRC1 and/or PRC2 target genes in normal human colon (N. colon) and HCT116 cell lines proficient or deficient for DNMT1 and DNMT3B by semi-quantitative RT-PCR. We defined expression at 35 cycles as moderate and at 50 (but not 35) cycles as low for normal colon. Reactions were repeated three times. Amplification of GAPDH serves as a loading control. ‘*’ homeobox gene.
Fig. 2
Fig. 2
DNA methylation analysis of DNMT3B+PRC1/PRC2 target genes in colon tumor cell lines. (A) DNA methylation patterns were determined for a subset of the genes examined in Fig. 1 using bisulfite genomic sequencing (BGS). The gene promoter region is shown, with the bent arrow denoting the transcription start site. CpG sites are indicated with tick marks and the region analyzed by pyrosequencing is indicated with a thick horizontal bar (‘Pyroseq’). Results are summarized below with open (unmethylated) or filled (methylated) circles for each CpG site. Each row is an individually cloned and sequenced molecule. Numbering is relative to the transcription start site. The total percent methylation over all clones and CpG sites is given at the left. (B) Quantitative bisulfite pyrosequencing DNA methylation analysis for twelve genes in eight colon tumor cell lines. Results are presented as the percent methylation over all CpG sites within the pyrosequenced region (part A and Fig. S2). Below each graph the expression status (‘Exp’) of the gene, derived from Fig. 1, is indicated with a ‘+’ for expressed and ‘−‘ for no expression.
Fig. 3
Fig. 3
Epigenetic silencing of DNMT3B+PcG target genes in primary colorectal tissues. For six of the genes analyzed in previous figures, we determined expression by semi-quantitative RT-PCR (representative gel photos at the bottom of each graph, GAPDH is shown in the JPH3 panel) and DNA methylation levels by bisulfite pyrosequencing in twelve fresh frozen human colorectal cancer (‘T’) and adjacent normal (‘N’) tissue pairs. Regions analyzed by pyrosequencing are shown in Fig. 2 and Fig. S2. Results are presented as the percent methylation for all CpG sites within the analyzed region. The error bar is the standard error and significance (*) is determined using the T-test (P < 0.05).
Fig. 4
Fig. 4
Genes co-regulated by DNMT3B, PRC1, and/or PRC2, and subject to epigenetic silencing in cancer, regulate cell growth. Colony formation assays were used to assess growth regulatory potential of seven genes. The full-length open reading frame was cloned into an expression vector and transfected into HCT15 cells. Colonies surviving G418 selection were counted and set relative to transfection with empty parental expression vector (at 1.0). (A) Summary of average growth suppression or enhancement relative to empty vector. The bar is the standard error and the asterisk indicates significance at the P-values indicated. (B) Representative wells from transfections following selection. A p16INK4a expression plasmid was used as a positive control for growth suppression.
Fig. 5
Fig. 5
Analysis of DNA methylation and the histone code at genes regulated by DNMT3B+PRC1/PRC2 reveals novel connections between H2A ubiquitination and DNMT3B. (A) BGS analysis of the HAND1 promoter defines a region of DNA methylation mediated by DNMT3B (boxed). Labeling is as in Fig. 2A. Methylation of the boxed region only is underlined. (B) BGS analysis of the IL1R2 promoter. (C) ChIP followed by semi-quantitative PCR analysis for the histone marks, PcG proteins, and DNMTs listed at the left of the gel photos for HAND1. (D) ChIP analysis of the IL1R2 promoter. Expression status of each gene is derived from Fig. 1B. ‘Me’ - methyl, ‘2x’ – dimethylated, ‘3x’ – trimethylated, ‘Ac’ – acetylated, ‘Ub’ – monoubiquitin, ‘NC’ – normal colon.
Fig. 6
Fig. 6
Relationships between DNMT status and levels of global and gene-specific epigenetic marks and their regulators. (A) Global levels of histone marks and PRC1/PRC2 complex proteins determined by western blotting. The antibody used is indicated at the left of the western panels. Staining of total core histones with coomassie blue (bottom) is used as a loading control. (B) ChIP analysis of the 14 indicated gene promoters for H2AK119 monoubiquitination, (C) trimethylated H3K27, (D) SUZ12 (PRC2 complex), (E) acetylated H3K9/K18, and (F) trimethylated H3K4. Following the gene symbol is the region analyzed by ChIP (relative to the transcription start site). The input is from DLGAP1.

References

    1. Goll MG, Bestor TH. Eukaryotic cytosine methyltransferases. Annu Rev Biochem. 2005;74:481–514. - PubMed
    1. Leonhardt H, Page AW, Weier H, Bestor TH. A targeting sequence directs DNA methyltransferase to sites of DNA replication in mammalian nuclei. Cell. 1992;71:865–873. - PubMed
    1. Okano M, Bell DW, Haber DA, Li E. DNA methyltransferases Dnmt3a and Dnmt3b are essential for de novo methylation and mammalian development. Cell. 1999;99:247–257. - PubMed
    1. Xu G-L, Bestor TH, Bourc'his D, et al. Chromosome instability and immunodeficiency syndrome caused by mutations in a DNA methyltransferase gene. Nature. 1999;402:187–191. - PubMed
    1. Hansen RS, Wijmenga C, Luo P, et al. The DNMT3B DNA methyltransferase gene is mutated in the ICF immunodeficiency syndrome. Proc Natl Acad Sci USA. 1999;96:14412–14417. - PMC - PubMed

Publication types

MeSH terms