

Review
doi: 10.1088/0031-9155/54/19/R01.
Epub 2009 Sep 1.
Photoacoustic tomography and sensing in biomedicine
Affiliations
- PMID: 19724102
- PMCID: PMC2872141
- DOI: 10.1088/0031-9155/54/19/R01
Item in Clipboard
Review
Photoacoustic tomography and sensing in biomedicine
Phys Med Biol.
.
Abstract
Photoacoustics has been broadly studied in biomedicine, for both human and small animal tissues. Photoacoustics uniquely combines the absorption contrast of light or radio frequency waves with ultrasound resolution. Moreover, it is non-ionizing and non-invasive, and is the fastest growing new biomedical method, with clinical applications on the way. This review provides a brief recap of recent developments in photoacoustics in biomedicine, from basic principles to applications. The emphasized areas include the new imaging modalities, hybrid detection methods, photoacoustic contrast agents and the photoacoustic Doppler effect, as well as translational research topics.
Figures
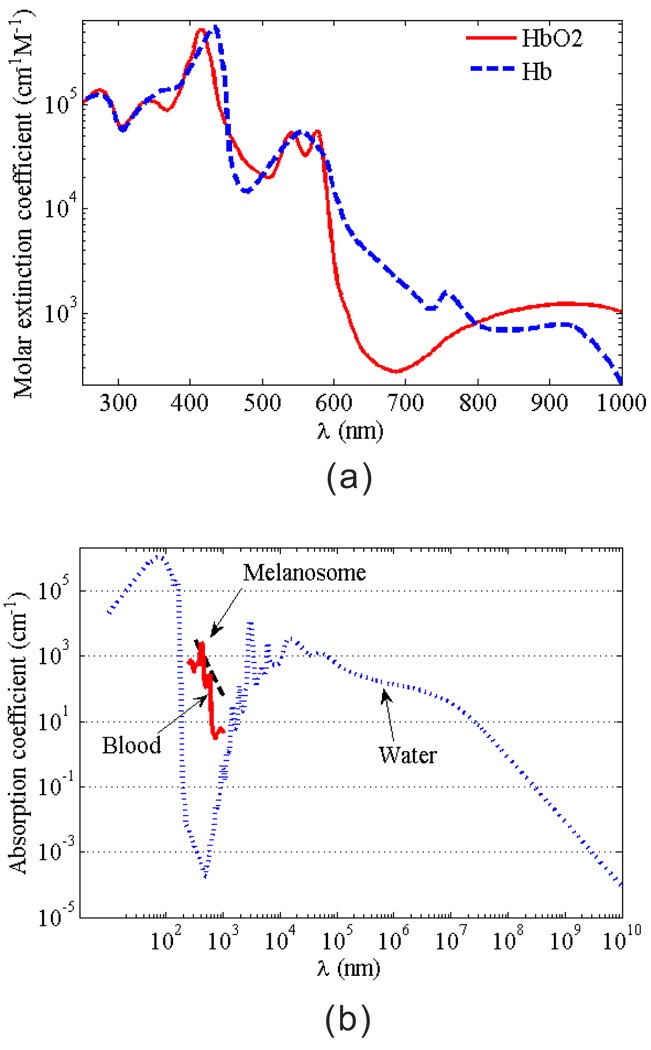
(Color online) (a) Molar extinction coefficients of oxygenated and de-oxygenated hemoglobin; (b) absorption coefficients of melanosomes, blood (at SO2=80% and total hemoglobin concentration of 2.33 × 10⁻³ mol/L), and water.
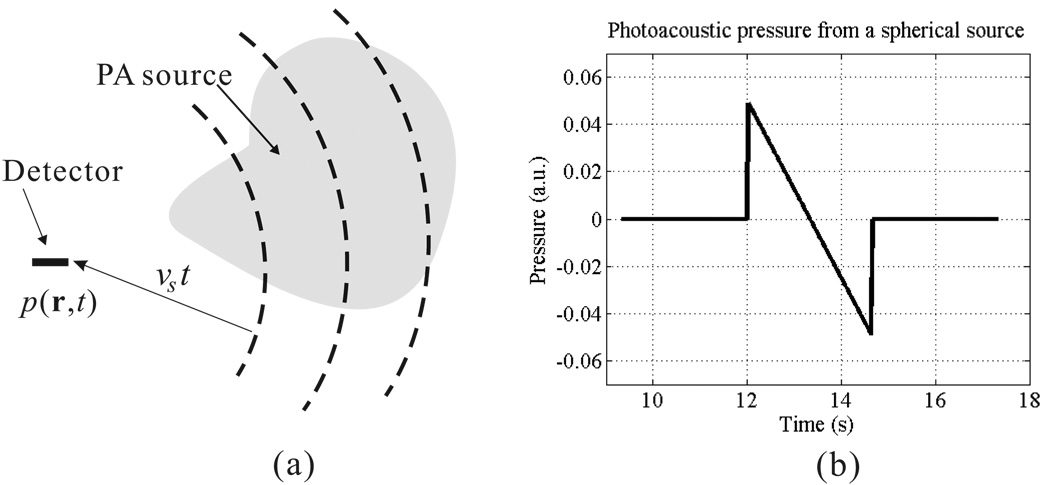
(a) The PA waves detected by a point detector at a certain time t come from sources over a spherical shell centered at the detector position and a radius of vst. (b) An example of the pressure generated by an uniform spherical PA source.
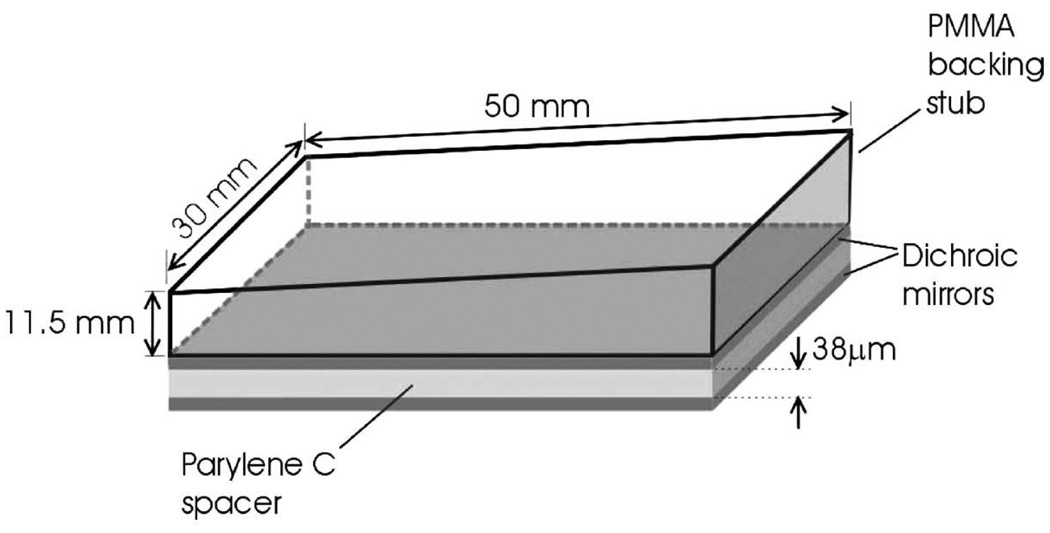
Schematic of FP sensor head. The sensing structure comprises a 38 µm polymer (Parylene C) film spacer sandwiched between two dichroic mirrors, forming an FPI. The latter overlays a PMMA backing stub that is wedged to eliminate parasitic interference between light reflected from its upper surface and the FPI. Reprinted with permission from Ref. [59]
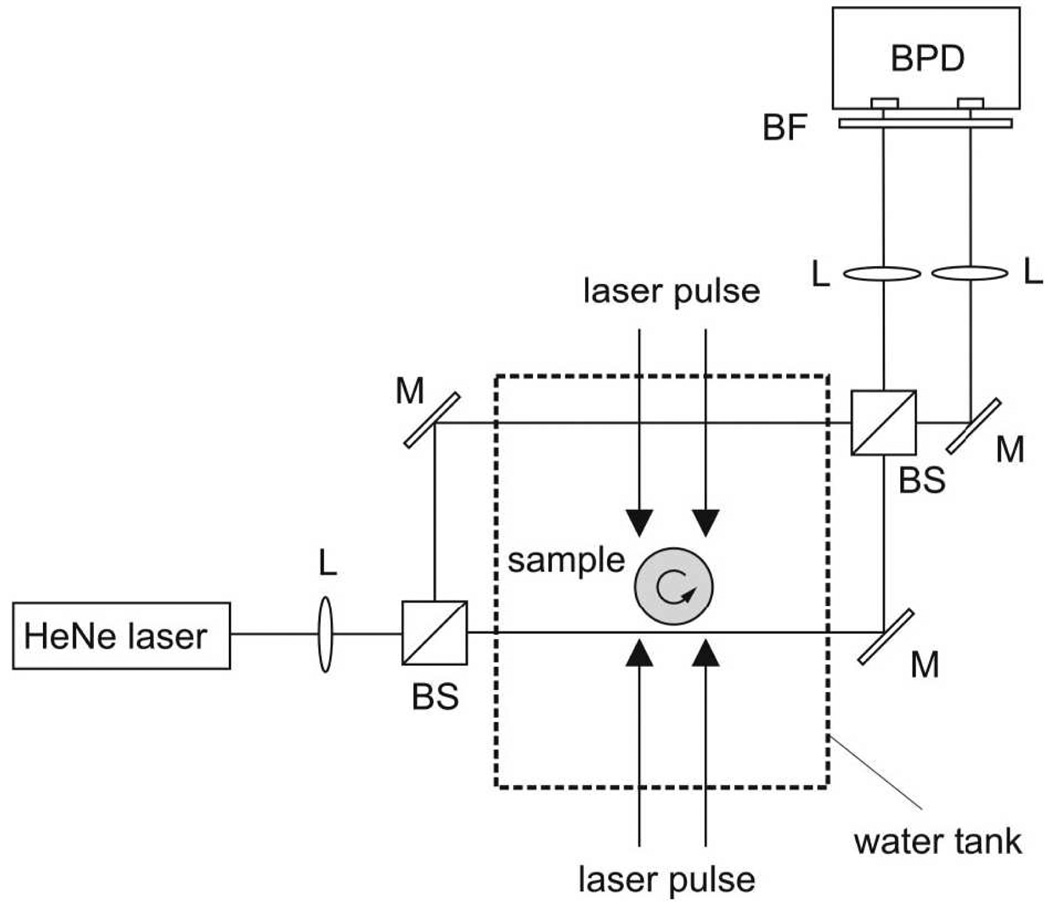
Experimental setup for photoacoustic tomography with a Mach–Zehnder interferometer as acoustic line detector. BS, beam splitter; M, mirror; BPD, balanced photodetector; L, lens; BF, bandpass filter. Reprinted with permission from Ref. [62]
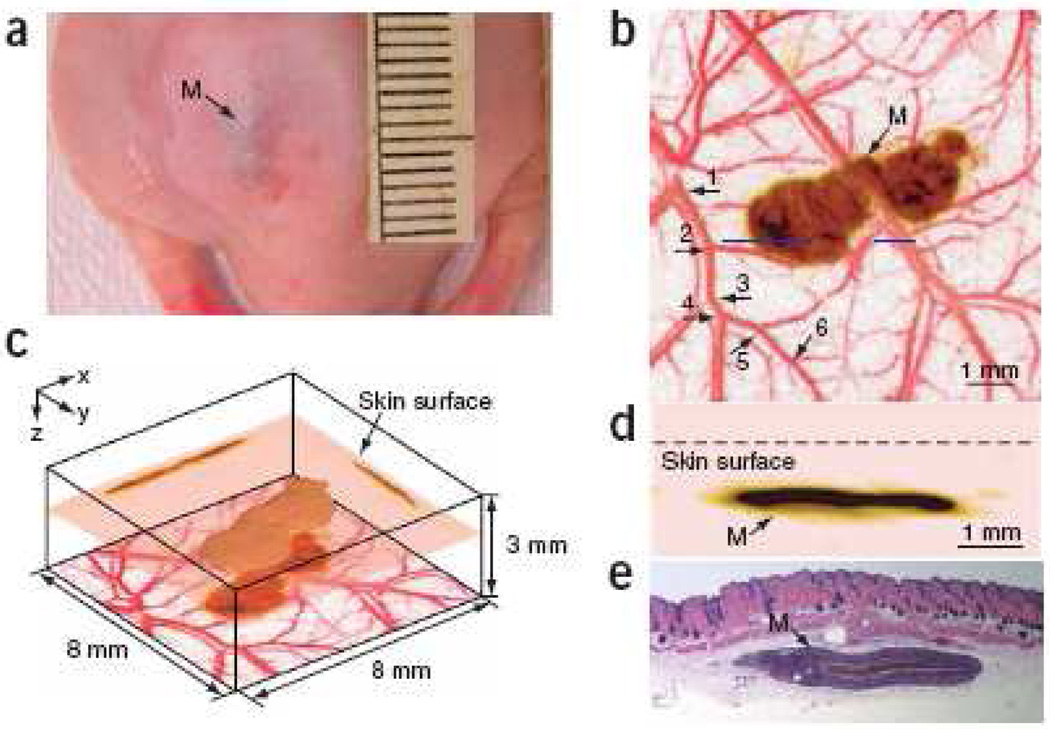
(Color online) In vivo imaging of a subcutaneously inoculated B16-melanoma in an immunocompromised nude mouse using fPAM at 584 nm and 764 nm. (a) Photograph of the melanoma. (b) A composite of the two maximum amplitude projection (MAP) images projected along the z axis, where an MAP image is formed by projecting the maximum photoacoustic amplitudes along a direction to its orthogonal plane. Here, blood vessels are pseudocolored red in the 584-nm image and the melanoma is pseudo-colored brown in the 764-nm image. As many as six orders of vessel branching can be observed in the image, as indicated by numbers 1–6. (c) Three dimensional rendering of the melanoma from the data acquired at 764 nm. Two MAP images at this wavelength projected along the x and y axes are shown on the two side walls, respectively. The composite image shown in (a) is redrawn at the bottom. The top surface of the tumor is 0.32 mm below the skin surface, and the thickness of the melanoma is 0.3 mm. (d) An enlarged cross-sectional (B-scan) image of the melanoma parallel with the z-x plane at the location marked with a dashed line in (a). (e) Hematoxylin-and-eosin (HE) stained section at the same marked location. M, melanoma. Reprinted by permission from Macmillan Publishers Ltd: [Nature Biotechnology] [97], copyright (2006)
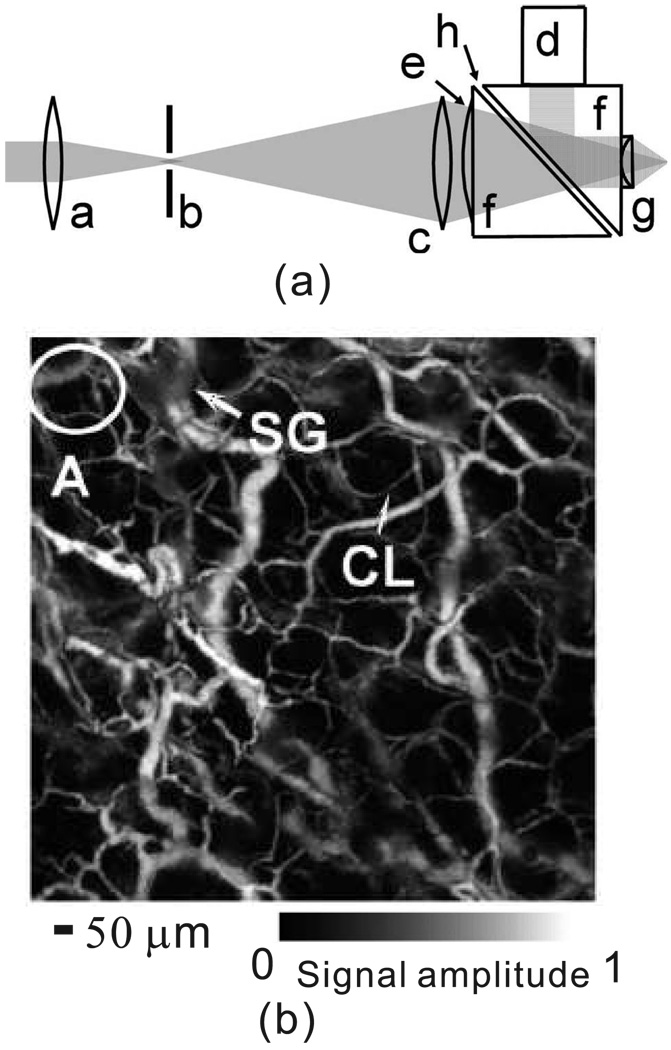
(a) Schematic of the OR–PAM system. a, Condenser lens; b, pinhole; c, microscope objective; d, ultrasonic transducer; e, correcting lens; f, isosceles prism; g, acoustic lens; h, silicon oil. (b) In vivo OR–PAM image of microvasculature in a nude mouse ear. CL, capillary, and SG, sebaceous gland. Reprinted with permission from [99].
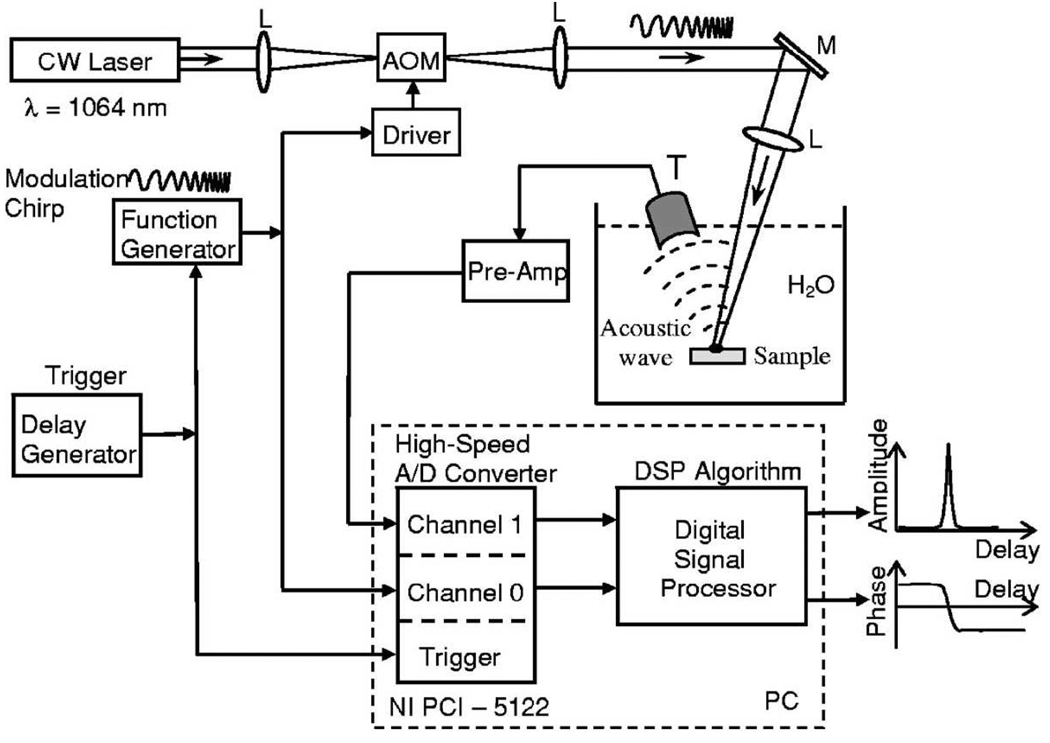
Schematic diagram of the frequency-domain PA imaging system with a frequency-swept laser source. AOM–acousto-optic modulator, L–lenses, M–mirror, T–ultrasonic transducer. Reprinted with permission from [105].
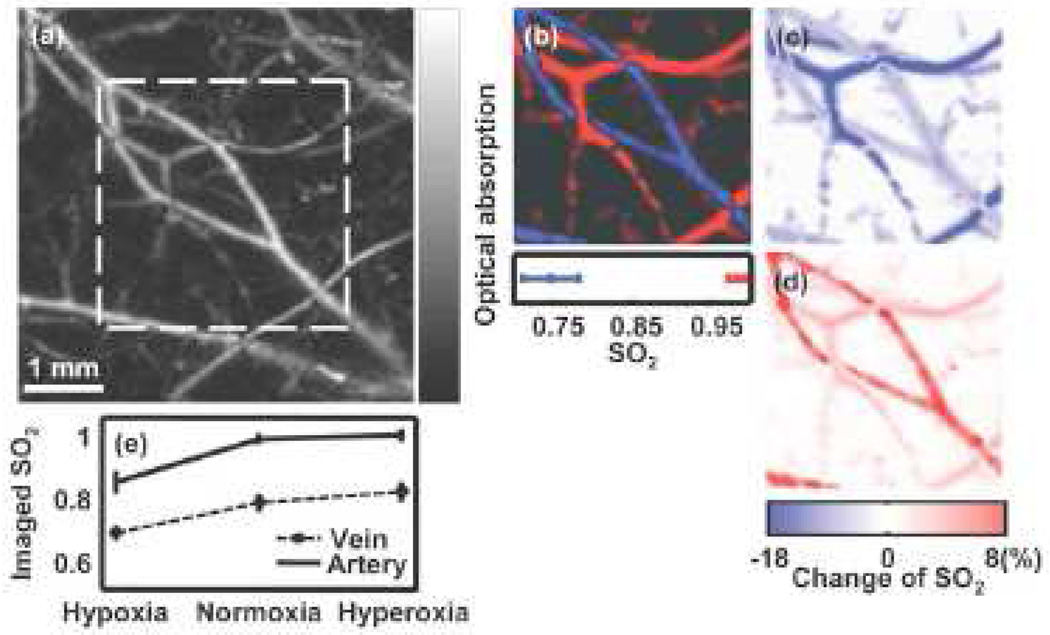
(Color online) PAM imaging of variations in SO2 in single subcutaneous blood vessels in a 200 g Sprague Dawley rat in vivo. (a) Structural image reflecting the total hemoglobin concentration acquired at the 584 nm optical wavelength under hyperoxia. (b) Static SO2 image within the marked region in panel A under normoxia, where arteries and veins are pseudocolored red and blue, respectively, based on the imaged SO2 values. (c) Image of the SO2 changes from normoxia to hypoxia (hypoxia value-normoxia value). (d) Image of SO2 changes from normoxia to hyperoxia (hyperoxia value-normoxia value). (e) Typical imaged values of SO2 in venous and arterial bloods under all three physiological states, where different trends of variation are observed. [This results relies on invisive methods to measure local fluence rate]. Reprinted with permission from [109]. Copyright (2007), American Institute of Physics.
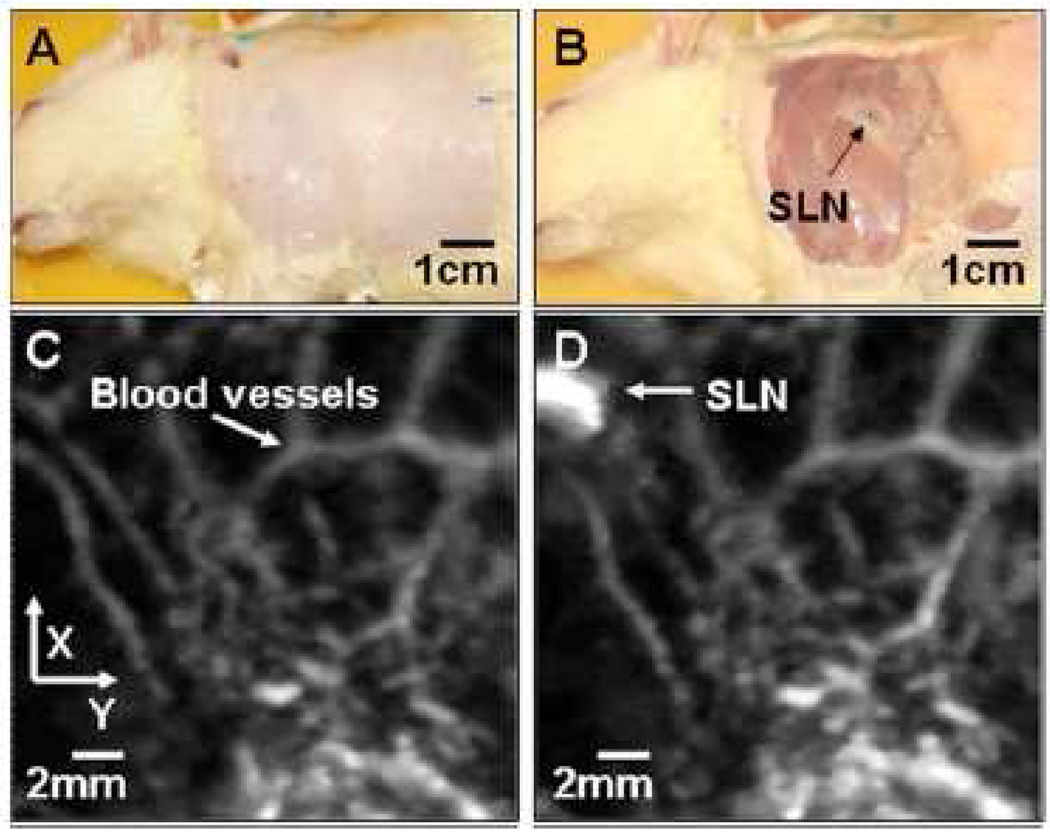
(Color online) Noninvasive in vivo photoacoustic MAP images of the SLN in a rat. (A) Photograph with hair removed before photoacoustic imaging. (B) Photograph with skin removed after photoacoustic imaging. (C) Control photoacoustic image without methylene blue injection. Bright parts represent optical absorption, here, blood vessels. x and y denote B-scan and 3-D imaging. (D) After-injection photoacoustic image. Reprinted with permission from [127].
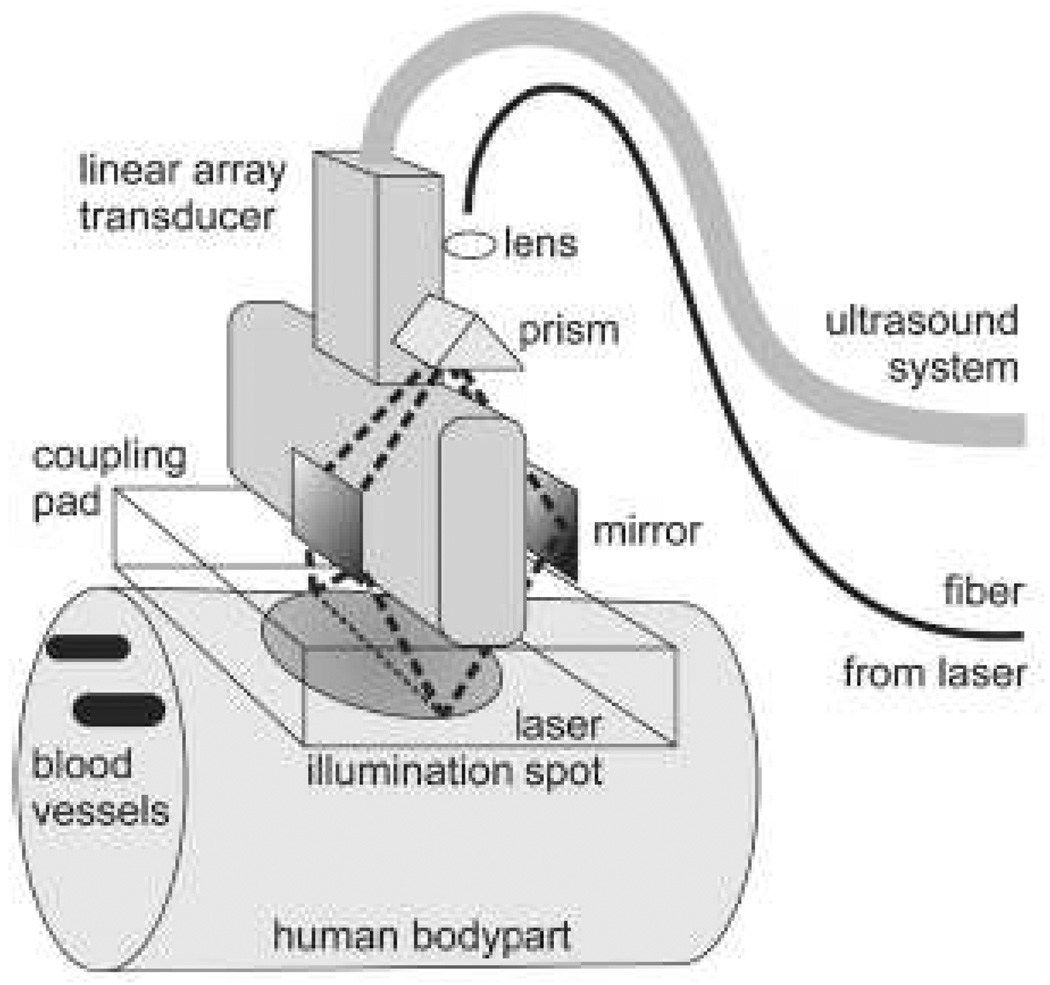
Combined optoacoustic and ultrasound real-time imaging setup. Short laser pulses are delivered through a fiber to the illumination system consisting of a lens, a prism and two mirrors. The illumination system images the core of the fiber around the transducer onto a homogeneously illuminated spot on the skin. The light penetrates into the highly scattering tissue and is absorbed in blood vessels, resulting in ultrasound transient generation (thermoelastic effect). The ultrasound transients propagate back to the skin surface, through the transparent acoustic coupling pad onto the ultrasound transducer. The signals of 64 transducer elements are simultaneously recorded with an ultrasound system and passed onto a computer. The computer reconstructs an absorption distribution image and displays it on a screen with a repetition rate of 7.5 Hz. One single laser pulse is enough to get a complete image on the screen in less than 100-ms reconstruction time. Classical echo ultrasound images can also be acquired for side by side comparison or for mixed mode imaging. Reprinted with permission from [65] (©2005 IEEE).
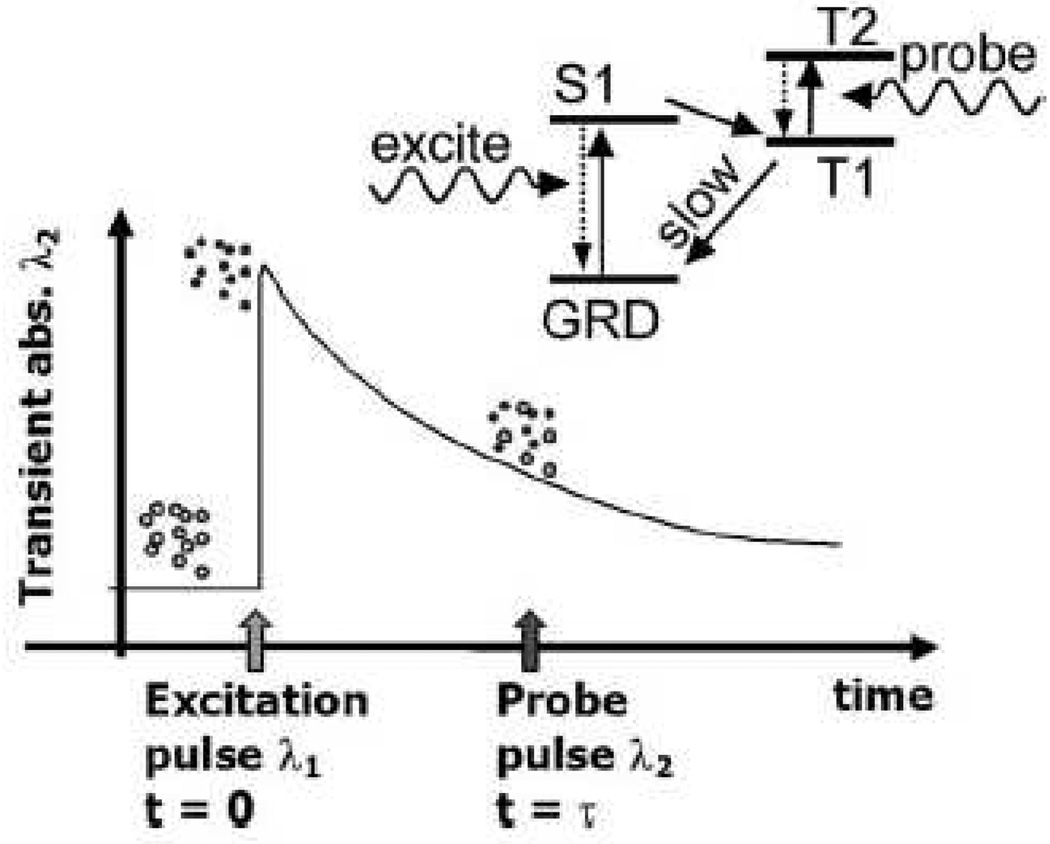
Basic principle of photoacoustic lifetime measurement of a phosphorescent oxygen sensitive dye. Dye molecules at ground state (open circles) are excited at t=0 (closed circles) by a short laser pulse of wavelength λ1 (532 nm in this paper). The dye molecule is excited to its first singlet state (S1) and then to a triplet state (T1) by internal system crossing. This process is relatively efficient (quantum yield of 50% for PtOEP dye) and occurs on a time scale of picoseconds. The population of the T1 excited state then decays back to the ground state via phosphorescence and quenching by collisions with oxygen molecules. The decay rate is relatively slow ~ 50 µs for PtOEP) and depends on oxygen concentration in the environment. A probe pulse (at 740 nm in this paper) fired at t=τ generates a photoacoustic response due to optical absorption corresponding to the T1 to T2 transition. The absorption is transient because of the decay of the population of the T1 state. The amplitude of the photoacoustic signal generated at different delay times τ is used to measure the decay rate of the T1 excited state population. Reprinted with permission from [146].
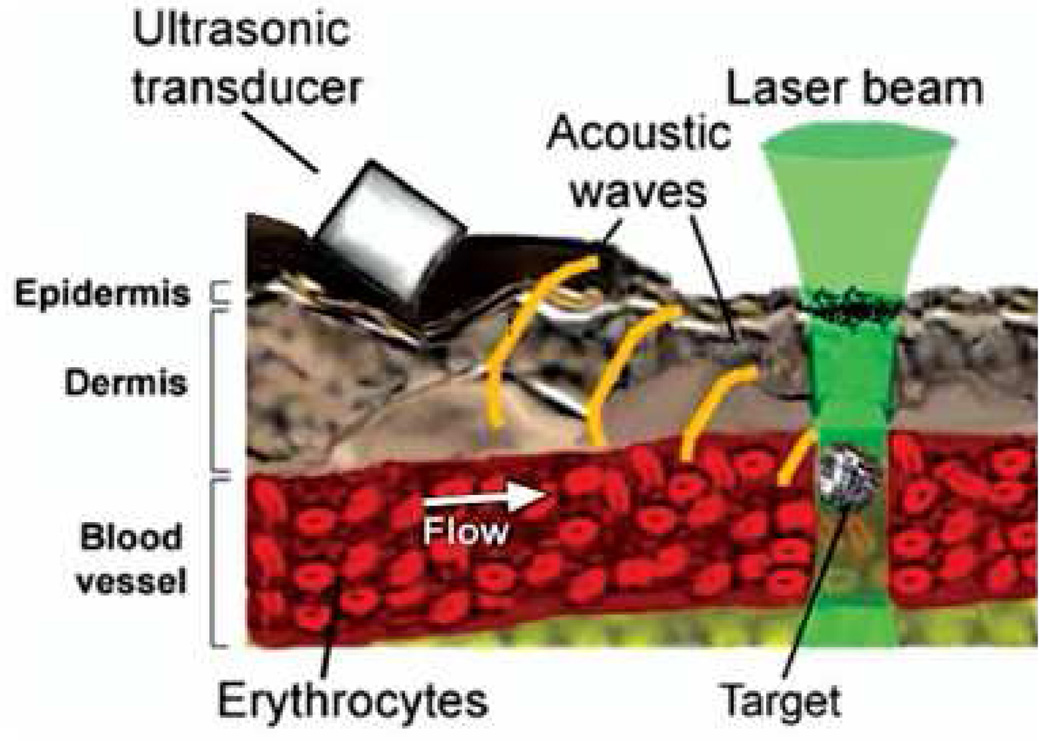
(Color online) Principle of PA detection of single absorbing targets in blood flow in vivo. Reprinted with permission from [101].
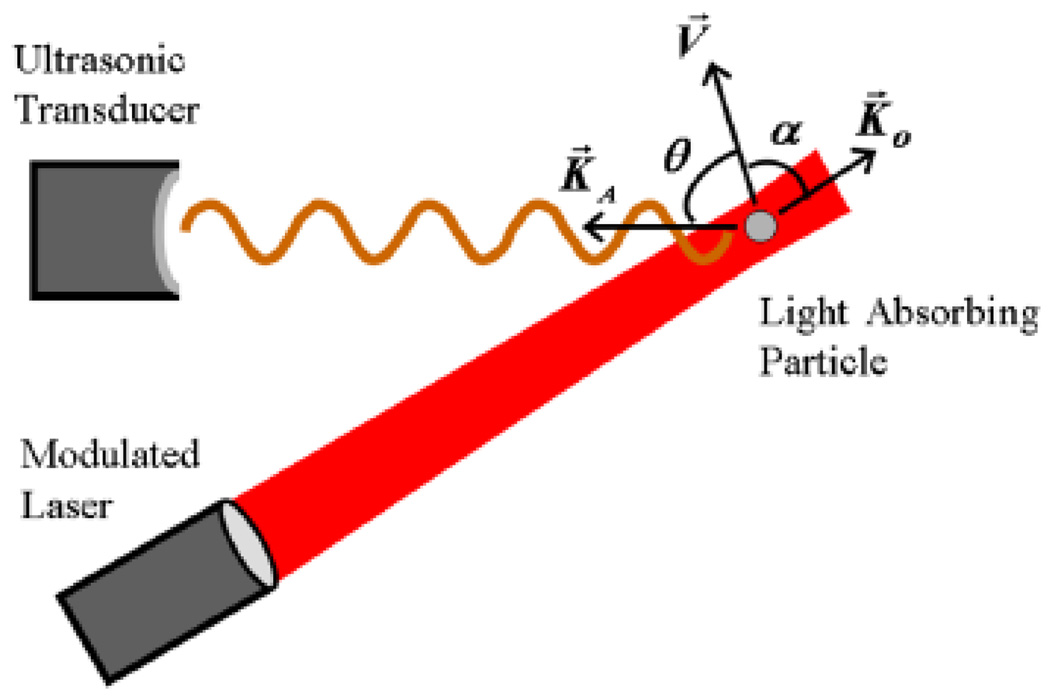
(Color online) Schematic for photoacoustic Doppler shift. The small light–absorbing particle moving along the velocity vector is illuminated by modulated continuous–wave light. K⃗0, V⃗ and K⃗A represent the directions of laser illumination, velocity of the absorber and acoustic waves, respectively. Reprinted figure with permission from [149]. Copyright (2007) by the American Physical Society.
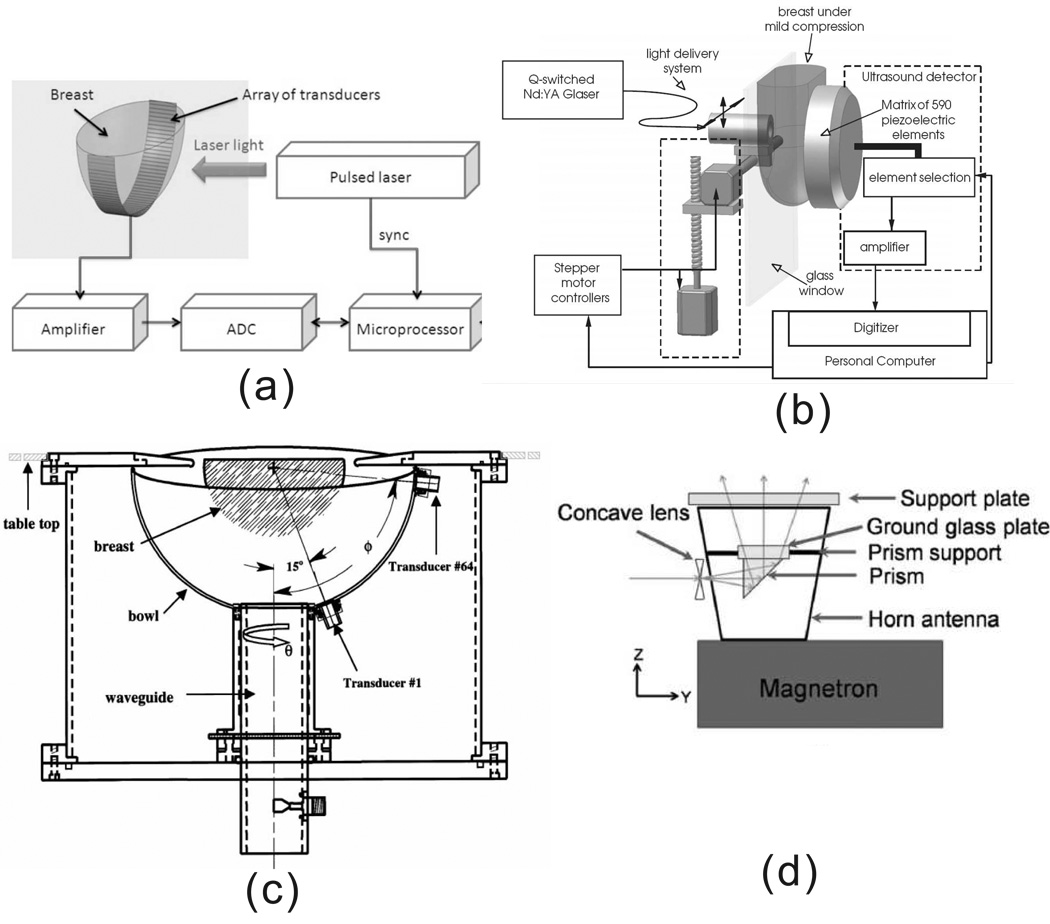
Several designs of breast imaging systems based on the PA effect. (a) Schematic diagram of LOIS-64. [This system uses a 64-element arc array to detect the PA signal. The laser, at 757 nm wavelength, illuminates the breast from one side.] Reprinted with permission from [47]. (b) Schematic of the Photoacoustic Mammoscope. [This system used a 590-element ultrasonic transducer matrix to detect PA signals. The laser, at 1064 wavelength, illuminates the breast on the opposite side of the breast.] Reprinted with permission from [152]. (c) Schematic of thermoacoustic CT scanner for breast imaging. Sixty-four transducers are arrayed on a 0.18-inch- (0.5-cm)-thick, hemispheric, acrylonitrile-butadiene-styrene plastic bowl (14-inch [36-cm] diameter). The locations of the transducers are indexed by the angles u and f. Transducers 1 and 64 are shown. UHF energy at 434 MHz was provided by a 2.8-inch-(8-cm)-diameter, water-filled, cylindric wave guide. The imaging bowl is rotated about the wave guide by means of a belt drive and stepper motor (not shown). The imaging bowl and wave guide are filled with deionized water and placed inside a water-filled cylindric tank with a top coincident with the top of the examination table. Reprinted with permission from [155]. (d) An integrated microwave horn antenna and optics. Reprinted with permission from [156].
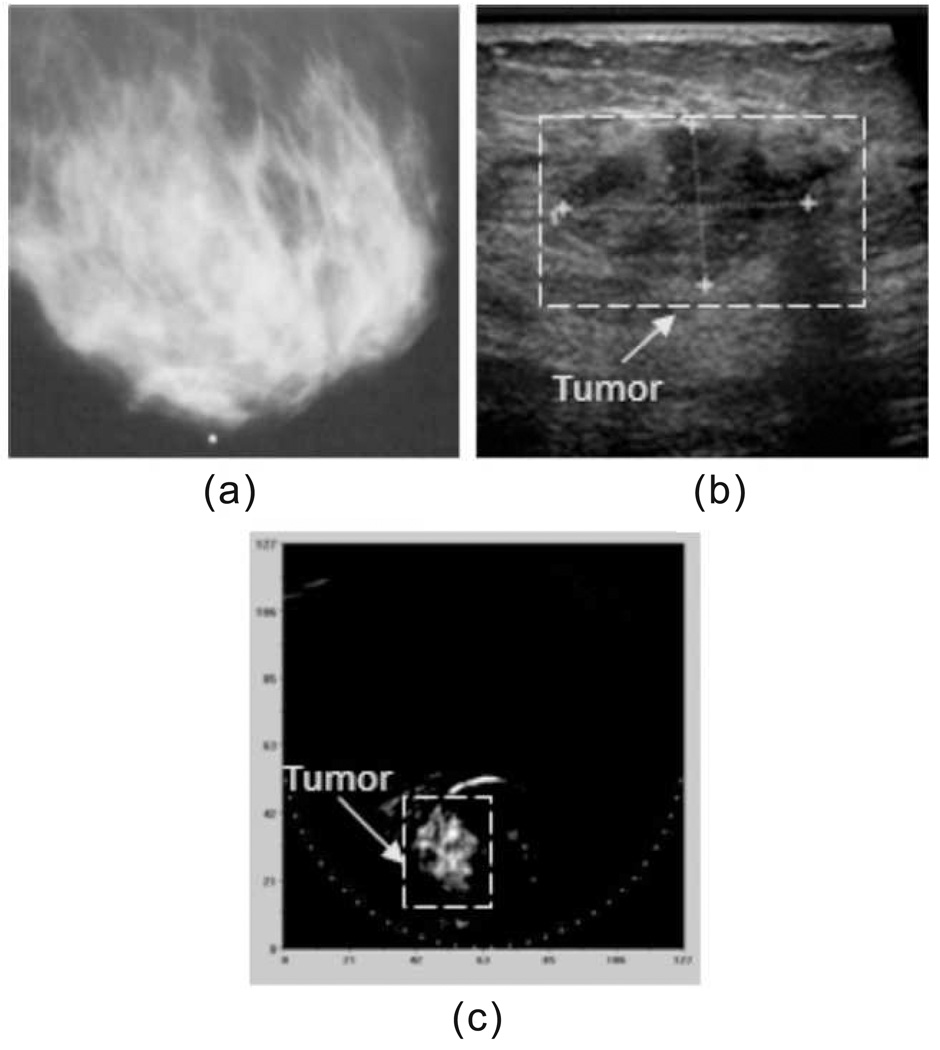
Example of the clinical images showing the breast cancer: (a) mediolateral mammography, (b) ultrasonic, and (c) mediolateral optoacoustic images. High contrast of the object in the OA image implies the advanced angiogenesis indicative of a malignant tumor. Reprinted with permission from [47]
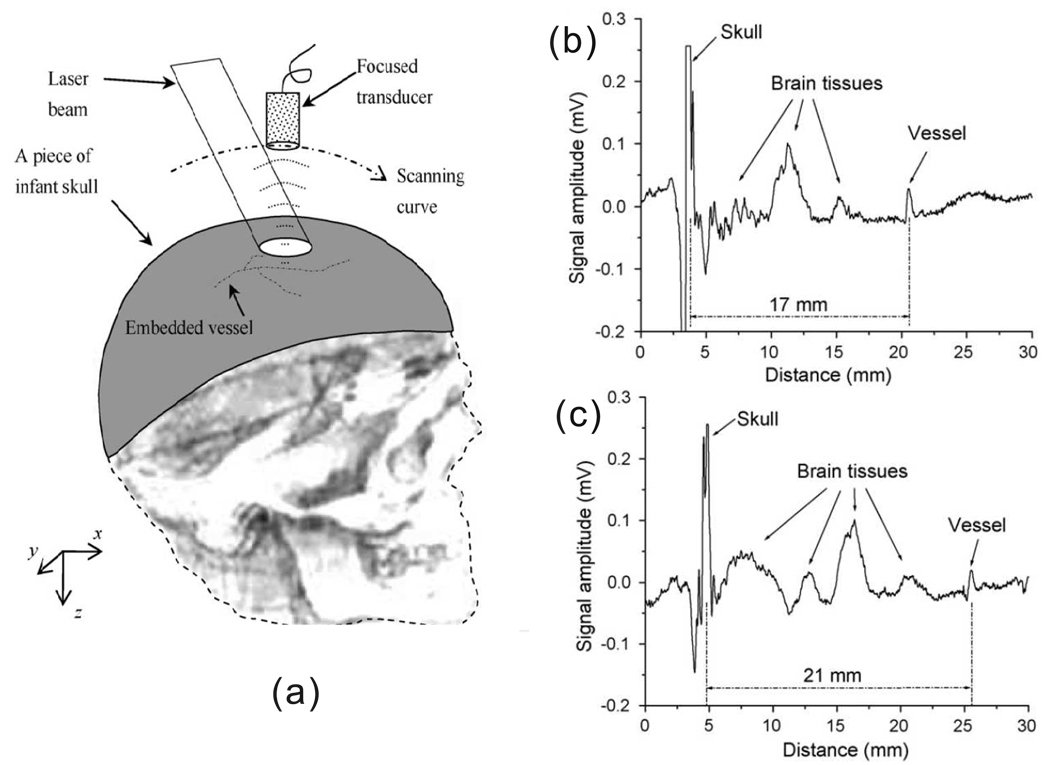
(a) Geometry of reflection mode transcranial photoacoustic imaging of brain. (b) PA signals from a vessel embedded in fresh canine brain tissue beneath the infant skull. The distance between the vessel and the skull is 17mm. (c) PA signals from the same vessel at the distance of 21mm. Reprinted from [169], with permission from Elsevier.
References
-
- Alexander Graham Bell On the production of sound by light. American Journal of Science. 1880;20:305.
-
- Kreuzer LB. Ultralow gas concentration infrared absorption spectroscopy. Journal of Applied Physics. 1971;42(7):2934–2943.
-
- Rosencwaig Allan. Photoacoustics and Photoacoustic Spectroscopy. New York: Wiley; 1980. Chemical analysis.
-
- Gusev VE, Karabutov AA, Hendzel Kevin. Laser Optoacoustics. AIP Press; 1993.
-
- Maugh Ii Thomas H. Photoacoustic spectroscopy: New uses for an old technique. Science. 1975;188(4183):38–39. - PubMed
Publication types
MeSH terms
Substances
Grants and funding
LinkOut - more resources
Full Text Sources
Other Literature Sources