

A topographic study of minicolumnar core width by lamina comparison between autistic subjects and controls: possible minicolumnar disruption due to an anatomical element in-common to multiple laminae
- PMID: 19725830
- PMCID: PMC8094785
- DOI: 10.1111/j.1750-3639.2009.00319.x
A topographic study of minicolumnar core width by lamina comparison between autistic subjects and controls: possible minicolumnar disruption due to an anatomical element in-common to multiple laminae
Abstract
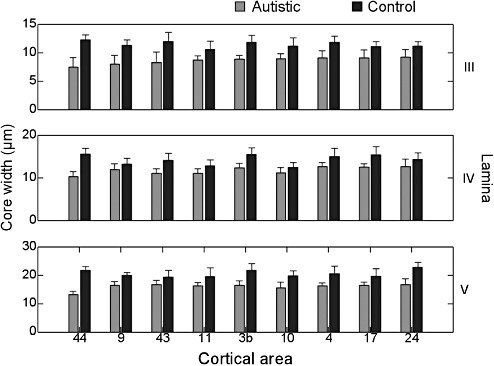
Radial cell minicolumns are basic cytoarchitectonic motifs of the mammalian neocortex. Recent studies reveal that autism is associated with a "minicolumnopathy" defined by decreased columnar width and both a diminished and disrupted peripheral neuropil compartment. This study further characterizes this cortical deficit by comparing minicolumnar widths across layers. Brains from seven autistic patients and an equal number of age-matched controls were celloidin embedded, serially sectioned at 200 microm and Nissl stained with gallocyanin. Photomicrograph mosaics of the cortex were analyzed with computerized imaging methods to determine minicolumnar width at nine separate neocortical areas: Brodmann Area's (BA) 3b, 4, 9, 10, 11, 17, 24, 43 and 44. Each area was assessed at supragranular, granular and infragranular levels. Autistic subjects had smaller minicolumns whose dimensions varied according to neocortical area. The greatest difference between autistic and control groups was observed in area 44. The interaction of diagnosis x cortical area x lamina (F(16,316) = 1.33; P = 0.175) was not significant. Diminished minicolumnar width across deep and superficial neocortical layers most probably reflects involvement of shared constituents among the different layers. In this article we discuss the possible role of double bouquet and pyramidal cells in the translaminar minicolumnar width narrowing observed in autistic subjects.
Figures


References
-
- Allman JM, Watson KK, Tetreault NA, Hakeem AY (2005) Intuition and autism: a possible role for Von Economo neurons. Trends Cogn Sci 9:367–373. - PubMed
-
- Arbib MA, Érdi P (2000) Précis of Structure, function, and dynamics: An integrated approach to neural organization . Behav Brain Sci 23:513–533. - PubMed
-
- Bailey A, Luthert PJ, Dean AF, Harding B, Janota I, Montgomery M et al (1998) A clinicopathological study of autism. Brain 121:889–905. - PubMed
-
- Bancroft JD, Gamble M (2002) Theory and Practice of Histological Techniques, 5th edn. Churchill Livingstone: New York.
-
- Bauman M, Kemper T (1985) Histoanatomic observations of the brain in early infantile autism. Neurology 35:866–874. - PubMed
MeSH terms
LinkOut - more resources
Full Text Sources
