

General and target-specific RNA binding properties of Epstein-Barr virus SM posttranscriptional regulatory protein
- PMID: 19726500
- PMCID: PMC2772688
- DOI: 10.1128/JVI.01483-09
General and target-specific RNA binding properties of Epstein-Barr virus SM posttranscriptional regulatory protein
Abstract
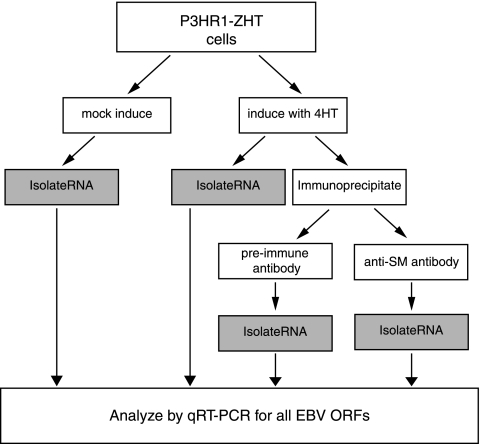
Epstein-Barr virus (EBV) SM protein is an essential nuclear shuttling protein expressed by EBV early during the lytic phase of replication. SM acts to increase EBV lytic gene expression by binding EBV mRNAs and enhancing accumulation of the majority of EBV lytic cycle mRNAs. SM increases target mRNA stability and nuclear export, in addition to modulating RNA splicing. SM and its homologs in other herpesvirus have been hypothesized to function in part by binding viral RNAs and recruiting cellular export factors. Although activation of gene expression by SM is gene specific, it is unknown whether SM binds to mRNA in a specific manner or whether its RNA binding is target independent. SM-mRNA complexes were isolated from EBV-infected B-lymphocyte cell lines induced to permit lytic EBV replication, and a quantitative measurement of mRNAs corresponding to all known EBV open reading frames was performed by real-time quantitative reverse transcription-PCR. The results showed that although SM has broad RNA binding properties, there is a clear hierarchy of affinities among EBV mRNAs with respect to SM complex formation. In vitro binding assays with two of the most highly SM-associated transcripts suggested that SM binds preferentially to specific sequences or structures present in noncoding regions of some EBV mRNAs. Furthermore, the presence of these sequences conferred responsiveness to SM. These data are consistent with a mechanism of action similar to that of hnRNPs, which exert sequence-specific effects on gene expression despite having multiple degenerate consensus binding sites common to a large number of RNAs.
Figures


Similar articles
-
Identification and Characterization of the Physiological Gene Targets of the Essential Lytic Replicative Epstein-Barr Virus SM Protein.J Virol. 2015 Nov 11;90(3):1206-21. doi: 10.1128/JVI.02393-15. Print 2016 Feb 1. J Virol. 2015. PMID: 26559842 Free PMC article.
-
Epstein-Barr virus (EBV) SM protein induces and recruits cellular Sp110b to stabilize mRNAs and enhance EBV lytic gene expression.J Virol. 2004 Sep;78(17):9412-22. doi: 10.1128/JVI.78.17.9412-9422.2004. J Virol. 2004. PMID: 15308735 Free PMC article.
-
Multiple roles of Epstein-Barr virus SM protein in lytic replication.J Virol. 2007 Apr;81(8):4058-69. doi: 10.1128/JVI.02665-06. Epub 2007 Feb 7. J Virol. 2007. PMID: 17287267 Free PMC article.
-
Lytic cycle switches of oncogenic human gammaherpesviruses.Adv Cancer Res. 2007;97:81-109. doi: 10.1016/S0065-230X(06)97004-3. Adv Cancer Res. 2007. PMID: 17419942 Review.
-
Post-transcriptional gene regulation by gamma herpesviruses.J Cell Biochem. 2005 Jul 1;95(4):698-711. doi: 10.1002/jcb.20465. J Cell Biochem. 2005. PMID: 15880690 Review.
Cited by
-
Kaposi's Sarcoma-Associated Herpesvirus Reduces Cellular Myeloid Differentiation Primary-Response Gene 88 (MyD88) Expression via Modulation of Its RNA.J Virol. 2015 Oct 14;90(1):180-8. doi: 10.1128/JVI.02342-15. Print 2016 Jan 1. J Virol. 2015. PMID: 26468534 Free PMC article.
-
HITS-CLIP analysis uncovers a link between the Kaposi's sarcoma-associated herpesvirus ORF57 protein and host pre-mRNA metabolism.PLoS Pathog. 2015 Feb 24;11(2):e1004652. doi: 10.1371/journal.ppat.1004652. eCollection 2015 Feb. PLoS Pathog. 2015. PMID: 25710169 Free PMC article.
-
Better late than never: A unique strategy for late gene transcription in the beta- and gammaherpesviruses.Semin Cell Dev Biol. 2023 Sep 15;146:57-69. doi: 10.1016/j.semcdb.2022.12.001. Epub 2022 Dec 17. Semin Cell Dev Biol. 2023. PMID: 36535877 Free PMC article. Review.
-
Viral genome methylation differentially affects the ability of BZLF1 versus BRLF1 to activate Epstein-Barr virus lytic gene expression and viral replication.J Virol. 2013 Jan;87(2):935-50. doi: 10.1128/JVI.01790-12. Epub 2012 Nov 7. J Virol. 2013. PMID: 23135711 Free PMC article.
-
Identification and Characterization of the Physiological Gene Targets of the Essential Lytic Replicative Epstein-Barr Virus SM Protein.J Virol. 2015 Nov 11;90(3):1206-21. doi: 10.1128/JVI.02393-15. Print 2016 Feb 1. J Virol. 2015. PMID: 26559842 Free PMC article.
References
-
- Bello, L. J., A. J. Davison, M. A. Glenn, A. Whitehouse, N. Rethmeier, T. F. Schulz, and J. Barklie Clements. 1999. The human herpesvirus-8 ORF 57 gene and its properties. J. Gen. Virol. 80:3207-3215. - PubMed
Publication types
MeSH terms
Substances
Grants and funding
LinkOut - more resources
Full Text Sources
