. 2009 Nov;83(22):11569-80.
doi: 10.1128/JVI.00742-09. Epub 2009 Sep 2.

Loss of the Brm-type SWI/SNF chromatin remodeling complex is a strong barrier to the Tat-independent transcriptional elongation of human immunodeficiency virus type 1 transcripts

Affiliations

Loss of the Brm-type SWI/SNF chromatin remodeling complex is a strong barrier to the Tat-independent transcriptional elongation of human immunodeficiency virus type 1 transcripts

Taketoshi Mizutani et al. J Virol. 2009 Nov.

Abstract

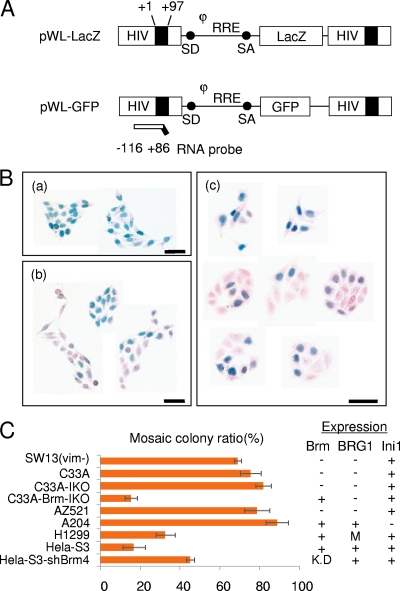
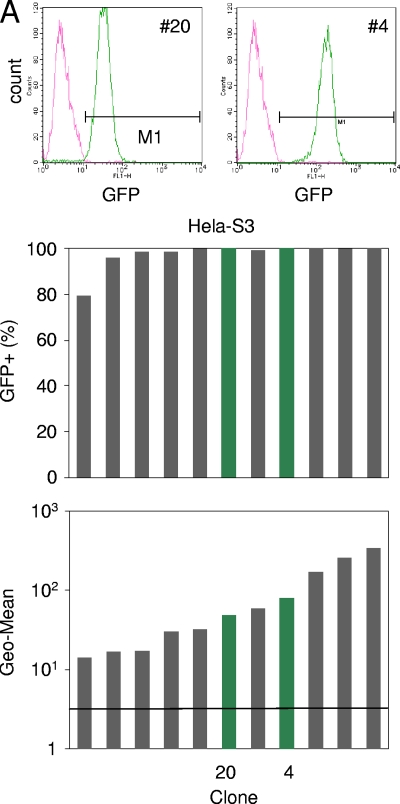
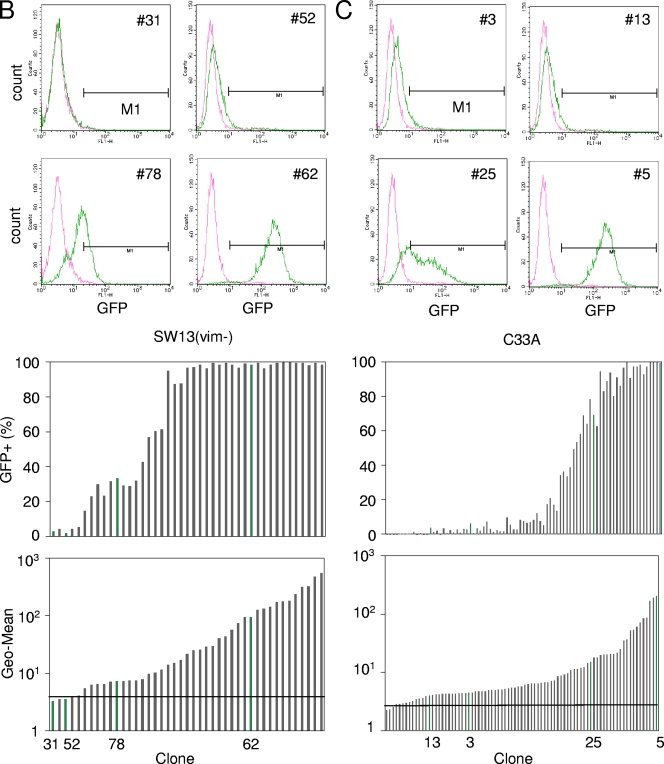
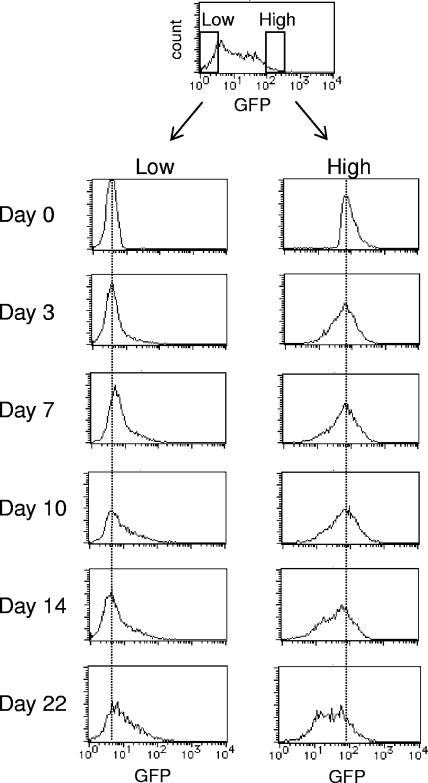
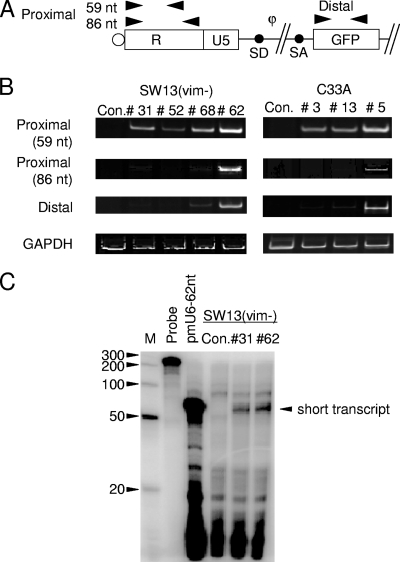
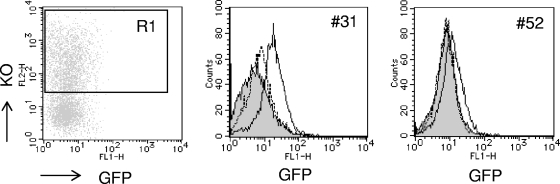
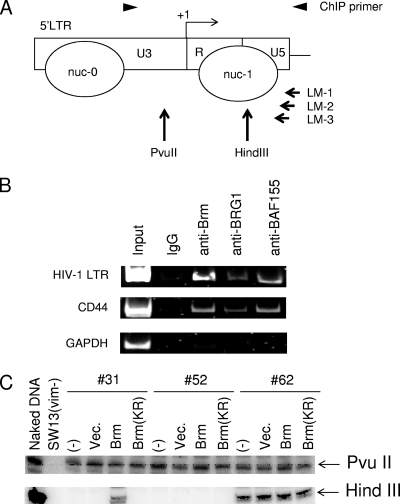
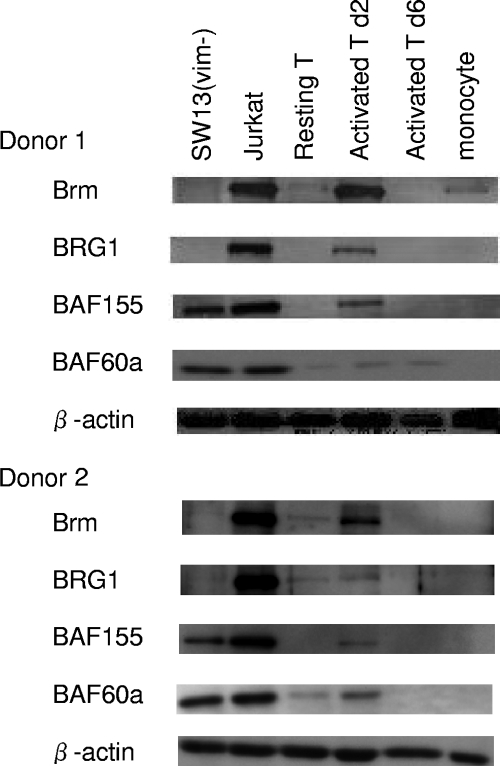
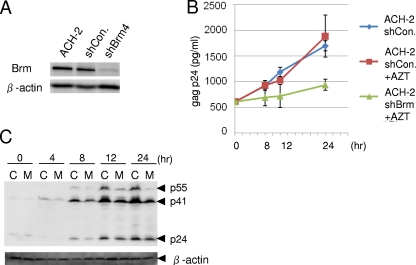
To elucidate the epigenetic regulation of Tat-independent human immunodeficiency virus (HIV) transcription following proviral integration, we constructed an HIV type 1 (HIV-1)-based replication-defective viral vector that expresses a reporter green fluorescent protein (GFP) product from its intact long terminal repeat (LTR). We transduced this construct into human tumor cell lines that were either deficient in or competent for the Brm-type SWI/SNF complex. One day after transduction, single cells that expressed GFP were sorted, and the GFP expression profiles originating from each of these clones were analyzed. Unlike clones of the SWI/SNF-competent cell line, which exhibited clear unimodal expression patterns in all cases, many clones originating from Brm-deficient cell lines either showed a broad-range distribution of GFP expression or were fully silenced. The resorting of GFP-negative populations of these isolated clones showed that GFP silencing is either reversible or irreversible depending upon the proviral integration sites. We further observed that even in these silenced clones, proviral gene transcription initiates to accumulate short transcripts of around 60 bases in length, but no elongation occurs. We found that this termination is caused by tightly closed nucleosome-1 (nuc-1) at the 5' LTR. Also, nuc-1 is remodeled by exogenous Brm in some integrants. From these results, we propose that Brm is required for the occasional transcriptional elongation of the HIV-1 provirus in the absence of Tat. Since the Brm-type SWI/SNF complex is expressed at marginal levels in resting CD4+ T cells and is drastically induced upon CD4+ T-cell activation, we speculate that it plays crucial roles in the early Tat-independent phase of HIV transcription in affected patients.


Figures

FIG. 1.
FIG. 1.
Prompt silencing of HIV-1-based vector expression occurs in some human cell lines. (A) Schematic representation of vectors pWL-LacZ and pWL-GFP. The position of the RNA probe (nt −116 to +86) used for RNase protection analysis is shown. The vectors contain an intact LTR, from which the lacZ or GFP reporter gene is driven from the HIV LTR. SD and SA, splice donor and splice acceptor sites, respectively; RRE, Rev-responsive element, which is necessary to export full-length proviral mRNA from the nucleus to the cytoplasm; φ, packaging signal that is necessary for the packaging of full-length vector RNA into the viral particle. (B) Cells were transduced with vector pWL-LacZ at a low MOI (less than 0.2) to minimize the introduction of multiple proviral copies. At 1 day after transduction, the transduced cultures were trypsinized and seeded at a very low cell density to enable single-colony formation. In vector-transduced HeLa-S3 cells (a), positive colonies were mostly observed. HeLa-S3-shBrm4 (b) and C33A (c) cells transduced with the pWL-LacZ vector formed mosaic colonies, as evidenced by the LacZ expression pattern on day 3 after seeding. (C) The mosaic colony ratio was calculated by dividing the mosaic colony number by the sum of the mosaic colony number and the positive colony number. The expression statuses for Brm, BRG1, and Ini1 are summarized at right. K.D and M represent “knockdown” and “mutation,” respectively. The error bars indicate the standard deviations (n = 3).
FIG. 2.
FIG. 2.
Single-cell sorting of HIV vector-transduced cells. Vector pWL-GFP was transduced into human cancer cell lines at a low MOI (0.2). At 24 h after transduction, GFP+ cells were single-cell sorted into 96-well plates (FACSAria cell sorting system). Clonal cell lines were analyzed for their GFP expression profiles at 3 weeks after sorting, and fluorescence-activated cell sorter patterns of some representative clones are shown (upper fluorescence-activated cell sorter analysis data and green bar in bar graph). The pink line and green line represent parental cell lines and sorted clones, respectively. The middle bar graph indicates the percentage of GFP+ cells, which were defined as cells within the M1 bar. The bottom bar graph indicates the geometric means (Geo-Mean) of cellular clones of HeLa-S3 (A), SW13(vim) (B), and C33A (C). The crossbars represent the geometric means of the parental cells (autofluorescence). In these bar graphs, the sorted clones were ordered using geometric means.
FIG. 2.
FIG. 2.
Single-cell sorting of HIV vector-transduced cells. Vector pWL-GFP was transduced into human cancer cell lines at a low MOI (0.2). At 24 h after transduction, GFP+ cells were single-cell sorted into 96-well plates (FACSAria cell sorting system). Clonal cell lines were analyzed for their GFP expression profiles at 3 weeks after sorting, and fluorescence-activated cell sorter patterns of some representative clones are shown (upper fluorescence-activated cell sorter analysis data and green bar in bar graph). The pink line and green line represent parental cell lines and sorted clones, respectively. The middle bar graph indicates the percentage of GFP+ cells, which were defined as cells within the M1 bar. The bottom bar graph indicates the geometric means (Geo-Mean) of cellular clones of HeLa-S3 (A), SW13(vim) (B), and C33A (C). The crossbars represent the geometric means of the parental cells (autofluorescence). In these bar graphs, the sorted clones were ordered using geometric means.
FIG. 3.
FIG. 3.
Time course analysis of the resorting of an HIV vector-transduced clone, C33A-25. Cell fractions from the C33A-25 cellular populations with either low or high GFP expression levels were resorted and grown for about 3 weeks. GFP expression profiles of the aliquots were analyzed on the days indicated.
FIG. 4.
FIG. 4.
Analysis of RNA transcripts in the pWLG-transduced cell clones. (A) Schematic of the pWL-GFP vector showing the location of RT-PCR primers (arrowheads). The proximal primers amplify both abortive and full-length products (R region of the 5′ LTR and the 3′ LTR) of transcription. The distal primer amplifies any full-length product of transcription. SD and SA, splice donor and splice acceptor sites, respectively. (B) Expression levels of the proviral transcripts were measured in the clones SW13(vim)-31, -52, -68, and -62 and C33A-3, -13, and -5 as well as the parental cell lines SW13(vim) and C33A by semiquantitative RT-PCR. Con., control. (C) RNase protection analysis of the clones SW13(vim)-31 and -62. The RNA probe used is described in the legend of Fig. 1A. Fifteen micrograms of small RNA extracts was used and hybridized with this probe at 37°C. Protected RNA fragments were resolved using 20% denaturing acrylamide gel electrophoresis at a high temperature. As a positive control, 62 nt of the TAR stem-loop region of HIV-1 transcripts driven by a mouse polymerase III type U6 promoter (pmU6-62nt) was used.
FIG. 5.
FIG. 5.
Exogenous Brm transduction of GFP-silenced clones. SW13(vim) clones were transfected with vectors carrying Brm and Brm-KR as well as a control plasmid (con). At 2 days after transfection, KO-positive cells (R1 gated) were sorted, and their GFP expression profiles were analyzed by flow cytometry. Brm-transduced cells are indicated by the bold line, Brm-KR-transduced cells are indicated by the dotted line, and nontransduced parental clones are indicated by the gray line.
FIG. 6.
FIG. 6.
Analysis of the HIV-1 LTR chromatin structure. (A) Map of the restriction sites and positions of nucleosomes (nuc-0 and nuc-1) in the HIV-1 LTR. The positions of ligation-mediated (LM) PCR primers are shown. The arrowheads indicate the PCR primer set used for the ChIP assay. (B) ChIP assay around the HIV-1 promoter site in the HeLa-S3-4 clone. Normal rabbit immunoglobulin G (IgG) was used as an antibody control. The PCR products were separated by polyacrylamide gel electrophoresis and stained with SYBR green I. Analysis of the GAPDH promoter was performed as a negative control, and analysis of the CD44 promoter was performed as a positive control. (C) Restriction enzyme accessibility assay of the HIV-1 LTR. Nuclei were isolated from untreated clones SW13(vim)-31, -52 and -62 and transfected with vectors expressing Brm, Brm-KR, or a control vector (Vec.). As a positive control, naked genomic DNA was purified from SW13(vim)-52 and then digested with PvuII or HindIII.
FIG. 7.
FIG. 7.
Purification and characterization of resting CD4+ T cells from a healthy donor. Shown is Western blotting of components of the SWI/SNF complex in resting CD4+ T cells, activated CD4+ T cells, and some human cancer cell lines. Brm and other components of SWI/SNF complexes were immunoblotted at 0, 2, and 6 days after cellular activation with anti-CD3 and anti-CD28 monoclonal antibodies.
FIG. 8.
FIG. 8.
Brm is required for the induction of HIV production from ACH-2 cells stimulated with TNF-α. (A) Expression levels of Brm in parental ACH-2 cells or those transduced with a retroviral vector expressing shBrm or control shRNA (shCon.). β-Actin was used for the internal control. (B) Kinetics of HIV production from these ACH-2 cells. Culture media were collected by centrifugation at 0, 8, 12, or 24 h after TNF-α (10 ng/ml) stimulation. p24gag antigen was detected by ELISA for the quantification of HIV particles. AZT, azidothymidine. (C) Expression of gag proteins in ACH-2 cells expressing shBrm (M) or control shRNA (C). Cellular pellets obtained in B were analyzed by Western blotting using anti-p24 antiserum.

Similar articles

Cited by

References

    1. Adachi, A., H. E. Gendelman, S. Koenig, T. Folks, R. Willey, A. Rabson, and M. A. Martin. 1986. Production of acquired immunodeficiency syndrome-associated retrovirus in human and nonhuman cells transfected with an infectious molecular clone. J. Virol. 59:284-291. - PMC - PubMed
    1. Adams, M., L. Sharmeen, J. Kimpton, J. M. Romeo, J. V. Garcia, B. M. Peterlin, M. Groudine, and M. Emerman. 1994. Cellular latency in human immunodeficiency virus-infected individuals with high CD4 levels can be detected by the presence of promoter-proximal transcripts. Proc. Natl. Acad. Sci. USA 91:3862-3866. - PMC - PubMed
    1. Adams, M., C. Wong, D. Wang, and J. Romeo. 1999. Limitation of Tat-associated transcriptional processivity in HIV-infected PBMC. Virology 257:397-405. - PubMed
    1. Arai, T., K. Matsumoto, K. Saitoh, M. Ui, T. Ito, M. Murakami, Y. Kanegae, I. Saito, F. L. Cosset, Y. Takeuchi, and H. Iba. 1998. A new system for stringent, high-titer vesicular stomatitis virus G protein-pseudotyped retrovirus vector induction by introduction of Cre recombinase into stable prepackaging cell lines. J. Virol. 72:1115-1121. - PMC - PubMed
    1. Arai, T., M. Takada, M. Ui, and H. Iba. 1999. Dose-dependent transduction of vesicular stomatitis virus G protein-pseudotyped retrovirus vector into human solid tumor cell lines and murine fibroblasts. Virology 260:109-115. - PubMed

Publication types

MeSH terms

Substances