Comparative Study
. 2009 Sep 2;29(35):10939-49.
doi: 10.1523/JNEUROSCI.1205-09.2009.

Sleep homeostasis modulates hypocretin-mediated sleep-to-wake transitions

Affiliations
Comparative Study

Sleep homeostasis modulates hypocretin-mediated sleep-to-wake transitions

Matthew E Carter et al. J Neurosci. .

Abstract

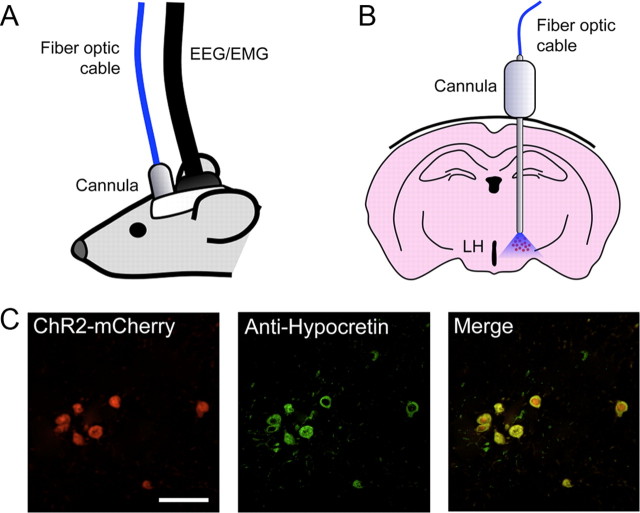
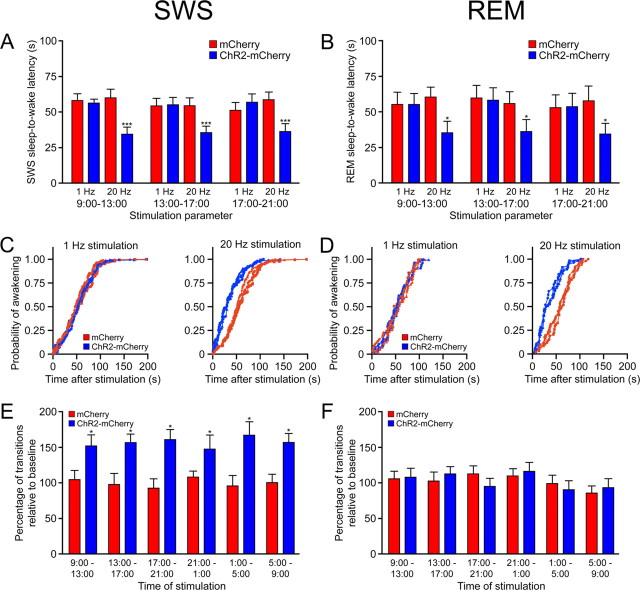
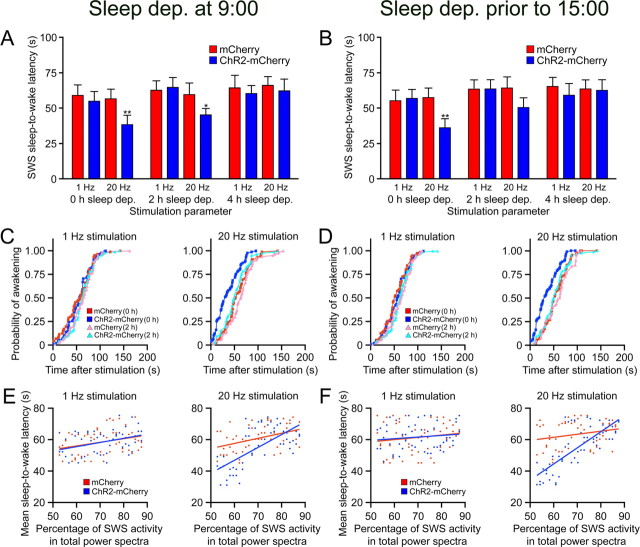
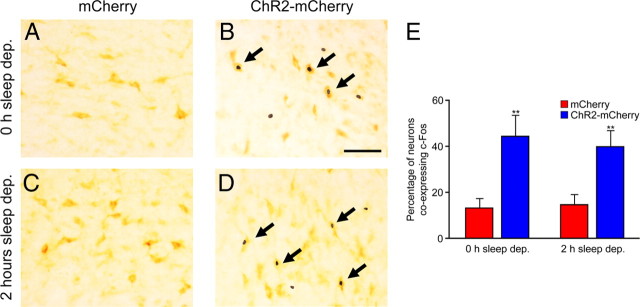
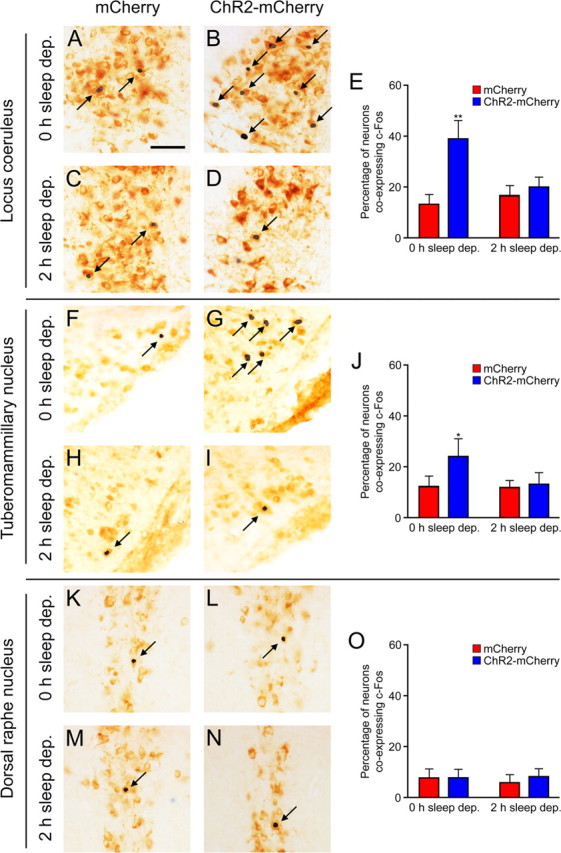
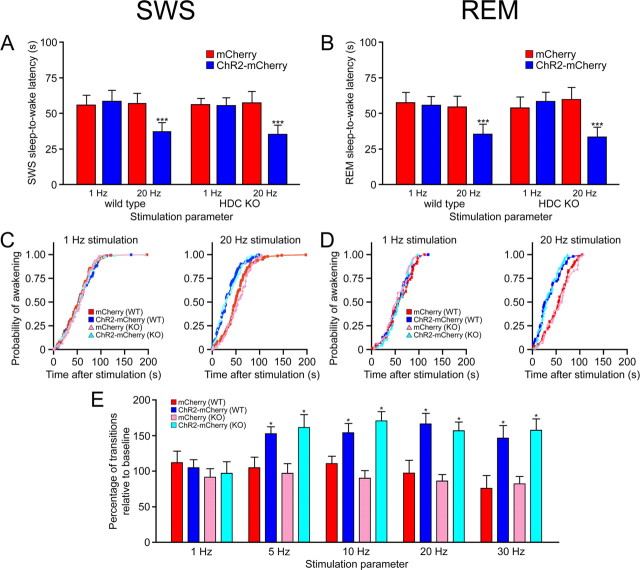
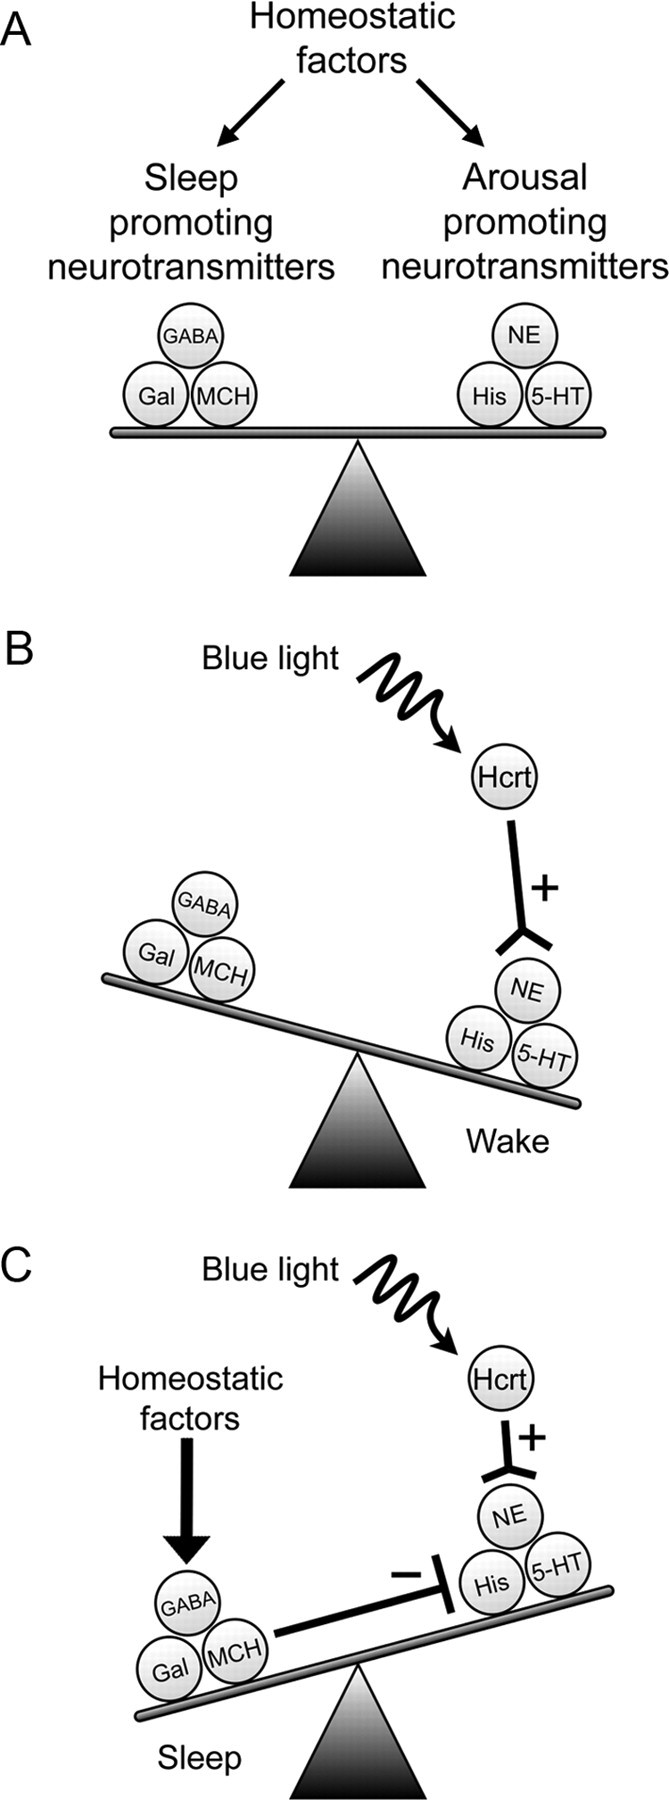
The hypocretins (Hcrts) (also called orexins) are two neuropeptides expressed in the lateral hypothalamus that play a crucial role in the stability of wakefulness. Previously, our laboratory demonstrated that in vivo photostimulation of Hcrt neurons genetically targeted with ChR2, a light-activated cation channel, was sufficient to increase the probability of an awakening event during both slow-wave sleep and rapid eye movement sleep. In the current study, we ask whether Hcrt-mediated sleep-to-wake transitions are affected by light/dark period and sleep pressure. We found that stimulation of Hcrt neurons increased the probability of an awakening event throughout the entire light/dark period but that this effect was diminished with sleep pressure induced by 2 or 4 h of sleep deprivation. Interestingly, photostimulation of Hcrt neurons was still sufficient to increase activity assessed by c-Fos expression in Hcrt neurons after sleep deprivation, although this stimulation did not cause an increase in transitions to wakefulness. In addition, we found that photostimulation of Hcrt neurons increases neural activity assessed by c-Fos expression in the downstream arousal-promoting locus ceruleus and tuberomammilary nucleus but not after 2 h of sleep deprivation. Finally, stimulation of Hcrt neurons was still sufficient to increase the probability of an awakening event in histidine decarboxylase-deficient knock-out animals. Collectively, these results suggest that the Hcrt system promotes wakefulness throughout the light/dark period by activating multiple downstream targets, which themselves are inhibited with increased sleep pressure.


Figures

Figure 1.
Figure 1.
Experimental setup used to stimulate Hcrt neurons in vivo while recording polysomnographic activity. A, A 26 gauge cannula was implanted unilaterally on each mouse just above the lateral hypothalamus. The cannula was used for stereotaxic injection of lentivirus and delivery of 473 nm blue laser light for photostimulation. For sleep recordings, EEG/EMG electrodes were also implanted just posterior to the cannula. The length of the fiber optic cable and EEG/EMG cable allowed the mouse to freely move about its cage. B, Drawing depicting stereotaxic placement of the cannula above the lateral hypothalamus (LH) according to the coordinates used by Paxinos and Franklin (2001). C, Representative colocalization of expression of mCherry (red) and anti-Hcrt antibody (green) from the brain of a ChR2–mCherry transduced mouse. Scale bar, 50 μm.
Figure 2.
Figure 2.
Stimulation of Hcrt neurons is sufficient to increase sleep-to-wake transitions across the inactive period. A, B, Latencies of wake transitions after stimulation during SWS (A) or REM sleep (B) of Hcrt::ChR2–mCherry transduced animals (n = 6) or Hcrt::mCherry control animals (n = 6). Photostimulation consisted of 15 ms light pulses at either 1 or 20 Hz for 10 s. Photostimulation periods took place at 9:00 A.M. to 1:00 P.M., 1:00 P.M. to 5:00 P.M., or 5:00 P.M. to 9:00 P.M., with the 12 h light inactive period starting at 9:00 A.M. Data analysis is based on an average of 30 or 10 stimulations per frequency and per mouse during SWS and REM sleep, respectively. Latencies represent mean ± SEM. Two-way ANOVA between stimulation parameter and time of day revealed no significant difference between latencies in Hcrt::ChR2–mCherry animals across the inactive period (p > 0.05). However, we found significant differences in the latencies between ChR2–mCherry and mCherry control animals at 20 Hz stimulation at all times tested (*p < 0.05, ***p < 0001 using a two-tailed Student's t test). C, D, Cumulative probability distribution of latencies from SWS (C) or REM sleep (D) after light stimulation (ChR2–mCherry animals, blue curves; mCherry control animals, red curves). The 20 Hz stimulation resulted in a significant shift in the probability curve for both SWS (p < 0.001, KS test) and REM (p < 0.001, KS test). E, Chronic stimulation of Hcrt neurons is sufficient to increase transitions from SWS to wakefulness across the circadian period. We used a chronic stimulation protocol (15 ms light pulses for 10 s every minute for 1 h, 20 Hz stimulation) to stimulate Hcrt::ChR2–mCherry mice (n = 4) or Hcrt::mCherry control mice (n = 4) at 4 h intervals throughout the entire circadian period. y-Axis represents the mean ± SEM number of transitions from SWS to wakefulness divided by the baseline number of transitions during that time interval. Analysis is based on duplicated stimulation sessions for each animal. *p < 0.05 using a two-tailed Student's t test between transduced animals. F, Chronic stimulation of Hcrt neurons is insufficient to increase transitions from REM to wakefulness throughout the circadian period. Same experimental conditions as E.
Figure 3.
Figure 3.
Sleep deprivation (2 or 4 h) moderates Hcrt-mediated sleep-to-wake transitions. A, B, We recorded the latencies of SWS-to-wake transitions in Hcrt::ChR2–mCherry transduced animals (n = 6) or Hcrt::mCherry control animals (n = 6) that were sleep deprived starting at the beginning of the inactive period (A) or in the afternoon (B). Photostimulation consisted of 15 ms light pulses at either 1 or 20 Hz for 10 s. Data analysis is based on an average of 30 stimulations per mouse during both conditions of sleep deprivation. Latencies represent mean ± SEM. We found a significant decrease in the latencies to wakening for both sleep deprivation conditions at 20 Hz between ChR2–mCherry and mCherry control animals that received no sleep deprivation (**p < 0.001, two-tailed Student's t test). After 2 h of sleep deprivation in the morning, the significant difference between ChR2–mCherry and mCherry animals decreased to p < 0.05, and there was no significant difference between animals sleep deprived in the afternoon. Four hours of sleep deprivation resulted in latencies that were not significantly different between animals (*p > 0.05, two-tailed Student's t test). C, D, Cumulative probability distribution of latencies from SWS after light stimulation in animals sleep deprived at the beginning of the inactive period (C) or in the afternoon (D) (ChR2–mCherry animals, blue curves; mCherry control animals, red curves). Probability curves from ChR2–mCherry animals that received no sleep deprivation were statistically different from the other distributions, including ChR2–mCherry animals after 2 h sleep deprivation (p < 0.001 for animals sleep deprived in the morning and afternoon, KS test). E, F, Correlograms comparing slow-wave EEG activity with the mean probability of wakefulness for each individual in animals sleep deprived at the beginning of the inactive period (E) or afternoon (F). Each dot represents one individual during one experimental session (n = 6 individuals × 3 sessions each) after 0, 2, and 4 h sleep deprivation (ChR2–mCherry animals, blue curves; mCherry control animals, red curves). Slow-wave activity is calculated as the percentage of delta power (0.5–4.0 Hz) in the entire power spectrum of EEG activity. The mean probability of wakefulness is the SWS-to-wake latency value occurring at a probabilistic value of 0.5. Linear regression analysis demonstrates a positive correlation (p < 0.0001) between the latency-to-wakening and SWS sleep power in ChR2–mCherry animals.
Figure 4.
Figure 4.
Stimulation of Hcrt neurons causes an increase in c-Fos expression in Hcrt neurons, with and without 2 h of sleep deprivation. We quantified the number of neurons expressing the immediate early gene c-Fos in Hcrt::mCherry animals (A, C) or Hcrt::ChR2–mCherry animals (B, D) after 0 (A, B) or 2 h (C, D) sleep deprivation (n = 6 for each condition). A–D, Representative images from neurons double stained for c-Fos (black) and Hcrt (light brown). Arrows indicate Hcrt-positive neurons coexpressing c-Fos. E, Quantification of data in A–D, depicting the percentage of Hcrt-positive neurons positive for c-Fos. **p < 0.001, two-tailed Student's t test. Scale bar, 50 μm.
Figure 5.
Figure 5.
Effect of stimulation of Hcrt neurons on c-Fos expression in downstream nuclei, with and without 2 h of sleep deprivation. We quantified the number of neurons expressing the immediate early gene c-Fos in Hcrt::mCherry animals (A, C, F, H, K, M) or Hcrt::ChR2–mCherry animals (B, D, G, I, L, N) after 0 h (A, B, F, G, K, L) or 2 h (C, D, H, I, M, N) sleep deprivation (n = 6 for each condition). A–D, Representative images taken from the locus ceruleus, with neurons double stained for c-Fos (black) and TH (light brown). F–I, Representative images taken from the tuberomammilary nucleus, with neurons double stained for c-Fos (black) and ADA (light brown). K–N, Representative images taken from the dorsal raphe nuclei, with neurons double stained for c-Fos (black) and TrH (light brown). Arrows indicate neurons stained for either TH, ADA, or TrH that also express c-Fos. E, J, O, Quantification of data in A–D, F–I, and K–N, respectively, depicting the percentage of neurons stained for either TH, ADA, or TrH also positive for c-Fos. *p < 0.05, **p < 0.001, two-tailed Student's t test. Scale bar, 50 μm.
Figure 6.
Figure 6.
Stimulation of Hcrt neurons is sufficient to increase sleep-to-wake transitions in HDC KO mice. A, B, Latencies to wake transitions after stimulation during SWS (A) or REM sleep (B) in wild-type animals or HDC KO animals transduced with either Hcrt::ChR2–mCherry or Hcrt::mCherry (n = 6 for each condition). Photostimulation consisted of 15 ms light pulses at either 1 or 20 Hz for 10 s. All photostimulation experiments took place from 1:00 to 5:00 P.M. Data analysis is based on an average of 30 or 10 stimulations per frequency and per mouse during SWS and REM sleep, respectively. Latencies represent mean ± SEM. We found significant differences in the latencies between ChR2–mCherry and mCherry control animals at 20 Hz stimulation (but not 1 Hz stimulation) in both wild-type and HDC KO animals (***p < 0.0001 using a two-tailed Student's t test). C, D, Cumulative probability distribution of latencies from SWS (C) or REM sleep (D) after light stimulation (ChR2–mCherry animals, blue/light blue curves; mCherry control animals, red/pink curves). The 20 Hz stimulation of ChR2–mCherry transduced animals significantly shifted the probability distributions in both wild-type and HDC KO mice during both SWS and REM sleep (p < 0.001, KS test). Furthermore, there was no significant difference between wild-type and HDC KO mice for any stimulation condition during SWS and REM sleep (p > 0.05, KS test). E, Stimulation of Hcrt neurons is sufficient to increase transitions from SWS to wakefulness in HDC KO mice. We used a chronic stimulation protocol (15 ms light pulses for 10 s every minute for 1 h) to test frequencies of stimulation at 1, 5, 10, 20, and 30 Hz stimulation in animals transduced with Hcrt::ChR2–mCherry (n = 4) and Hcrt::mCherry (n = 4). We measured the number of transitions from SWS to wakefulness for each frequency and found a significant increase in the number of transitions in Hcrt::ChR2–mCherry transduced animals compared with control animals for stimulations greater that 5 Hz. Data represent the mean ± SEM number of transitions from SWS to wakefulness. Analysis is based on duplicated stimulation sessions for each animal. *p < 0.05 using a two-tailed Student's t test between ChR2–mCherry and mCherry transduced animals.
Figure 7.
Figure 7.
A model of Hcrt-mediated promotion of wakefulness. A, The balance between sleep and wake states is facilitated by sleep-promoting and arousal-producing neurotransmitters expressed in specific nuclei of the hypothalamus and brainstem. These neurons are influenced by circadian and homeostatic factors that regulate neuron excitability, gene expression, and synaptic efficacy. B, Stimulation of Hcrt neurons excites arousal-producing neurons, shifting the balance between sleep–wake states and increasing the probability of an awakening event. C, In conditions of increased sleep pressure, sleep-promoting neurons and neurotransmitters actively inhibit arousal-promoting nuclei. Arousal-promoting nuclei may also be inhibited by external factors and autoregulation by long-term depression of excitatory synapses and circadian downregulation of gene expression. The inhibition of these arousal-promoting nuclei may overpower the excitatory input from ChR2-stimulated Hcrt neurons. Thus, although ChR2 is sufficient to drive action potentials in Hcrt cells, the afferent projections are inadequate to overcome the inhibition attributable to increased sleep pressure. 5HT, Serotonin; Gal, galanin; His, histamine; MCH, melanin-concentrating hormone; NE, norepinephrine.

Similar articles

Cited by

References

    1. Abumaria N, Rygula R, Hiemke C, Fuchs E, Havemann-Reinecke U, Rüther E, Flügge G. Effect of chronic citalopram on serotonin-related and stress-regulated genes in the dorsal raphe nucleus of the rat. Eur Neuropsychopharmacol. 2007;17:417–429. - PubMed
    1. Achermann P, Borbély AA. Mathematical models of sleep regulation. Front Biosci. 2003;8:S683–S693. - PubMed
    1. Adamantidis A, de Lecea L. Physiological arousal: a role for hypothalamic systems. Cell Mol Life Sci. 2008;65:1475–1488. - PMC - PubMed
    1. Adamantidis AR, Zhang F, Aravanis AM, Deisseroth K, de Lecea L. Neural substrates of awakening probed with optogenetic control of hypocretin neurons. Nature. 2007;450:420–424. - PMC - PubMed
    1. Alilain WJ, Li X, Horn KP, Dhingra R, Dick TE, Herlitze S, Silver J. Light-induced rescue of breathing after spinal cord injury. J Neurosci. 2008;28:11862–11870. - PMC - PubMed

Publication types