Comparative Study
. 2009 Sep 2;29(35):10974-8.
doi: 10.1523/JNEUROSCI.2123-09.2009.

Presynaptically expressed long-term potentiation increases multivesicular release at parallel fiber synapses

Affiliations
Comparative Study

Presynaptically expressed long-term potentiation increases multivesicular release at parallel fiber synapses

Vanessa A Bender et al. J Neurosci. .

Abstract

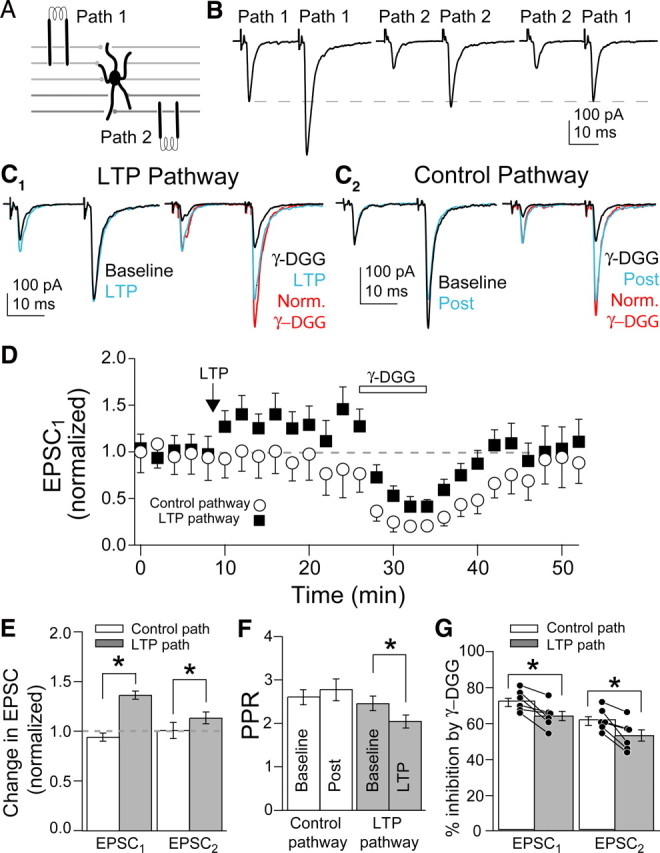
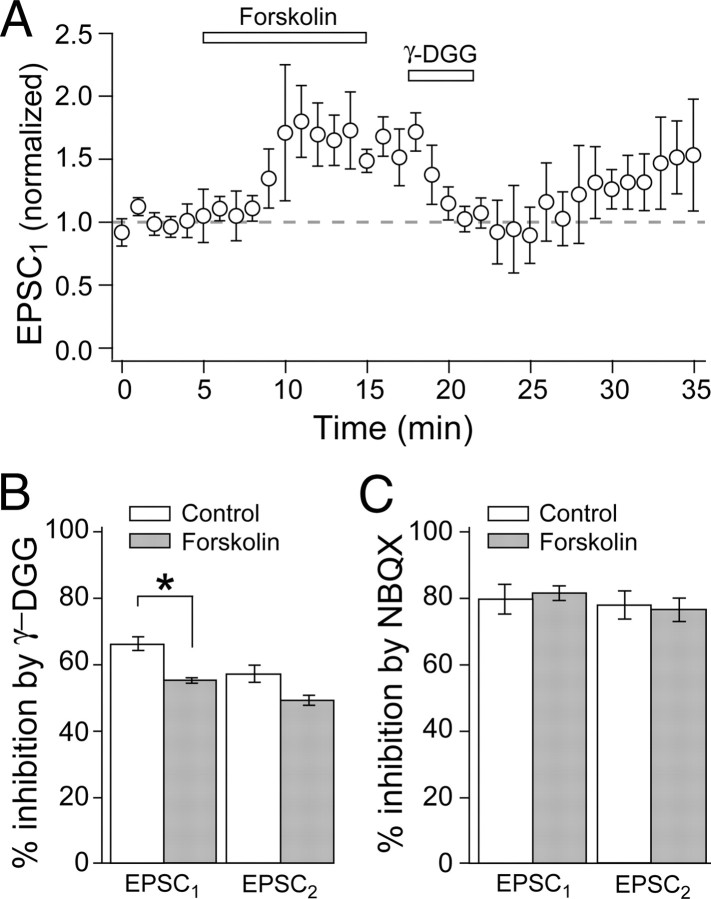
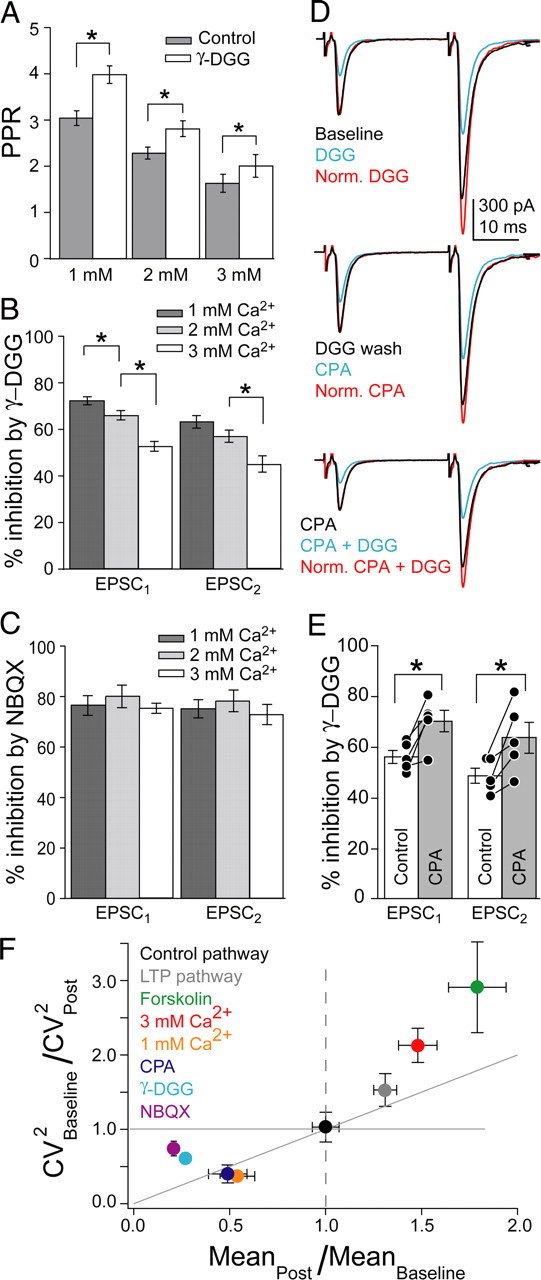
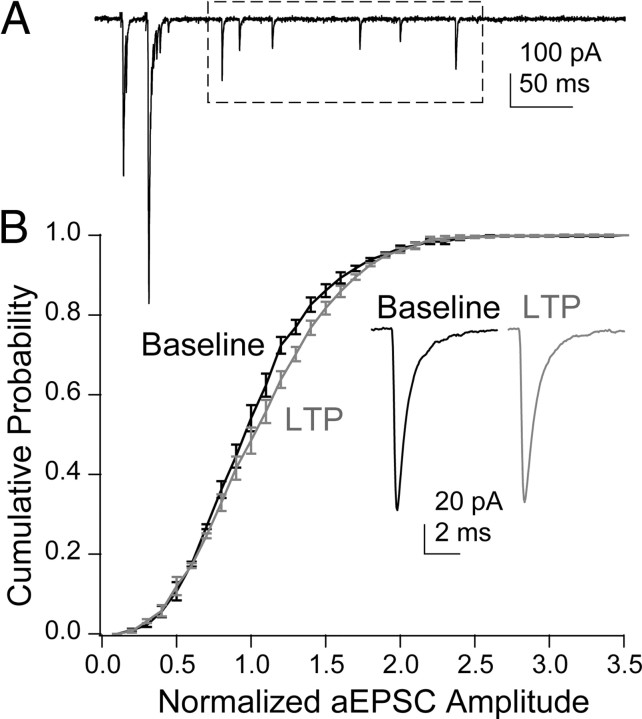
At a number of synapses, long-term potentiation (LTP) can be expressed by an increase in presynaptic strength, but it is unknown whether presynaptic LTP is expressed solely through an increase in the probability that a single vesicle is released or whether it can increase multivesicular release (MVR). Here, we show that presynaptic LTP decreases inhibition of AMPA receptor EPSCs by a low-affinity antagonist at parallel fiber-molecular layer interneuron (PF-MLI) synapses. This indicates that LTP induction results in larger glutamate concentration transients in the synaptic cleft, a result indicative of MVR, and suggests that MVR can be modified by long-term plasticity. A similar decrease in inhibition was observed when release probability (PR) was increased by forskolin, elevated extracellular Ca2+, and paired-pulse facilitation. Furthermore, we show that MVR may occur under baseline physiological conditions, as inhibition increased when P(R) was lowered by reducing extracellular Ca2+ or by activating presynaptic adenosine receptors. These results suggest that at PF-MLI synapses, MVR occurs under control conditions and is increased when PR is elevated by both short- and long-term plasticity mechanisms.


Figures

Figure 1.
Figure 1.
MVR increased after presynaptic LTP induction. A, Schematic of independent PF pathway stimulation onto MLI. Stimulation electrodes were placed at different depths in the cerebellar slice. B, Left, PF EPSCs evoked by paired stimuli on Path 1. Middle, EPSCs evoked by stimuli on Path 2. Right, Path 1 was stimulated 20 ms after Path 2 to check for facilitation of Path 1. Dashed line, Amplitude of the first Path 1 EPSC. C1, Left, EPSCs before (baseline) and after LTP induction (LTP). Right, Effect of γ-DGG on EPSCs after LTP induction. C2, In the same cell as C1, EPSCs evoked on the control pathway. Left, EPSCs before (baseline) and after (post) LTP was induced on the other pathway. Right, Effect of γ-DGG on EPSCs evoked on control pathway. D, Average time course of the two pathway experiments. E, F, Summary of the changes for EPSCs and PPR on both pathways. G, Percentage inhibition by γ-DGG for EPSCs compared between pathways within a single cell. Bars are SEM. Asterisks, p < 0.05.
Figure 2.
Figure 2.
MVR increased with forskolin application. A, Time course of average EPSC1 amplitudes, in control, forskolin, and γ-DGG. B, Percentage inhibition of EPSCs by γ-DGG before and after forskolin application. Control refers to cells in 2 mm Ca2+. C, Percentage inhibition of EPSCs by NBQX before and after forskolin application.
Figure 3.
Figure 3.
MVR covaried with PR. A, PPR in control conditions and during γ-DGG application in 1, 2, and 3 mm Ca2+. B, Percentage inhibition by γ-DGG in 1, 2, and 3 mm Ca2+ for EPSCs. C, Percentage inhibition by NBQX in 1, 2, and 3 mm Ca2+. D, Top, EPSCs before and after γ-DGG application. Middle, EPSCs in the same cell after γ-DGG wash and subsequent CPA application. Bottom, γ-DGG was applied again in the presence of CPA. E, Percentage inhibition of EPSCs by γ-DGG before and during CPA application within single cells. F, CV analysis, plotted as the ratio of CV−2 versus the mean amplitude ratio, normalized to baseline. For increases in mean amplitude (mean ratio, >1), points that fall on or above the diagonal signify a presynaptic change, whereas for decreases in mean amplitude (mean ratio, <1), presynaptic changes are reflected in points that fall on or below the diagonal.
Figure 4.
Figure 4.
Quantal size is not altered by LTP induction. A, Asynchronous events (box) after paired stimulation of PFs. B, Cumulative probability plots of the amplitudes of aEPSCs in control and after inducing LTP. Inset, Averages of aEPSCs in the two conditions. All non-overlapping aEPSCs after the decay of the second evoked EPSC were included in the analysis.

References

    1. Atluri PP, Regehr WG. Delayed release of neurotransmitter from cerebellar granule cells. J Neurosci. 1998;18:8214–8227. - PMC - PubMed
    1. Balakrishnan V, Kuo SP, Roberts PD, Trussell LO. Slow glycinergic transmission mediated by transmitter pooling. Nat Neurosci. 2009;12:286–294. - PMC - PubMed
    1. Bekkers JM, Stevens CF. Presynaptic mechanism for long-term potentiation in the hippocampus. Nature. 1990;346:724–729. - PubMed
    1. Biró AA, Holderith NB, Nusser Z. Release probability-dependent scaling of the postsynaptic responses at single hippocampal GABAergic synapses. J Neurosci. 2006;26:12487–12496. - PMC - PubMed
    1. Carter AG, Regehr WG. Prolonged synaptic currents and glutamate spillover at the parallel fiber to stellate cell synapse. J Neurosci. 2000;20:4423–4434. - PMC - PubMed

Publication types