

Neutralization of the charge on Asp 369 of Na+,K+-ATPase triggers E1 <--> E2 conformational changes
- PMID: 19726667
- PMCID: PMC2781504
- DOI: 10.1074/jbc.M109.050054
Neutralization of the charge on Asp 369 of Na+,K+-ATPase triggers E1 <--> E2 conformational changes
Abstract
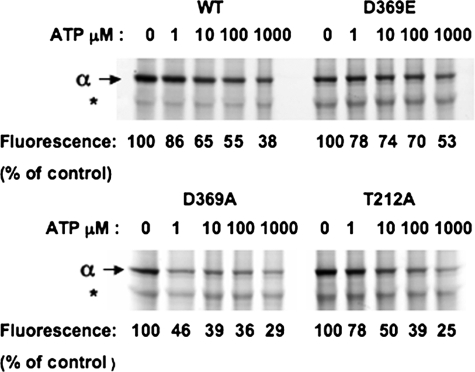
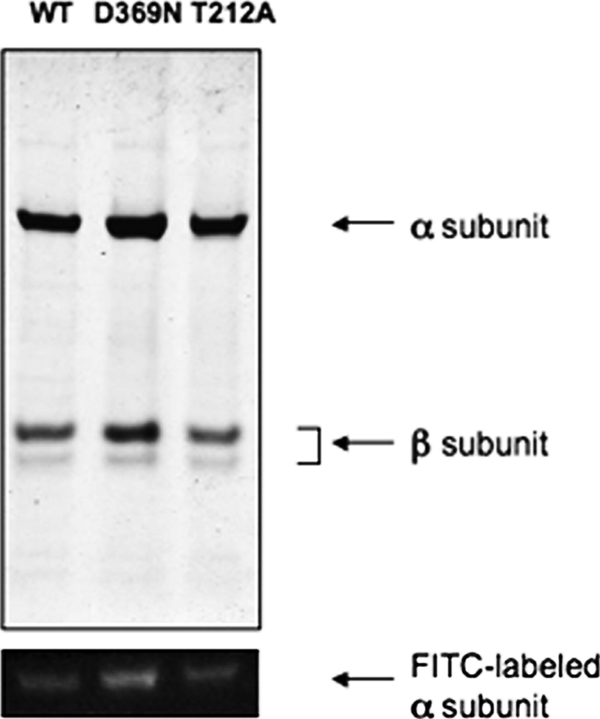
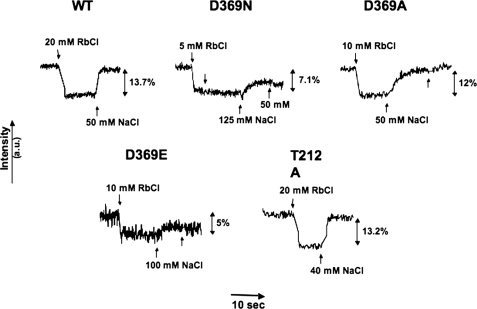
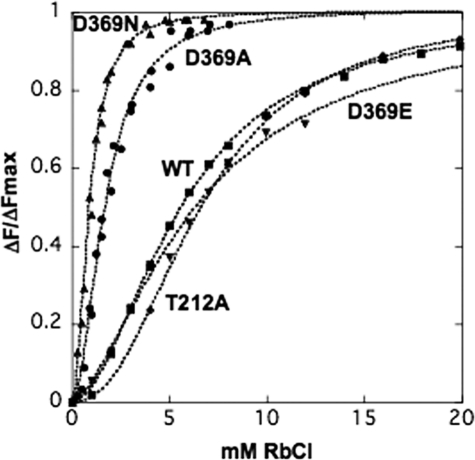
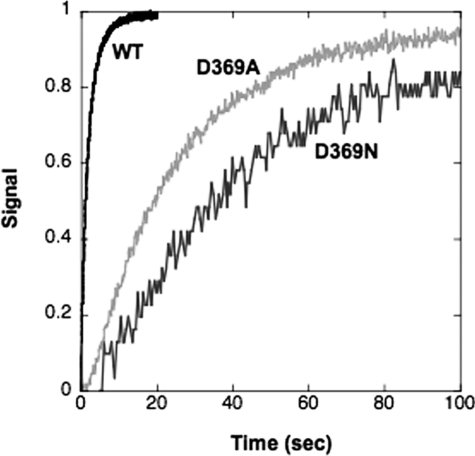
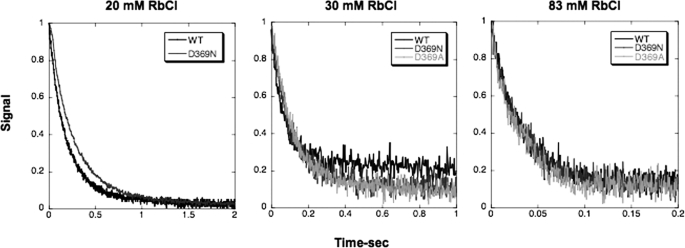
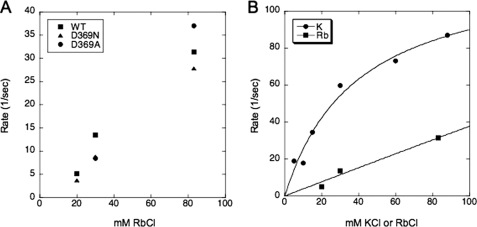
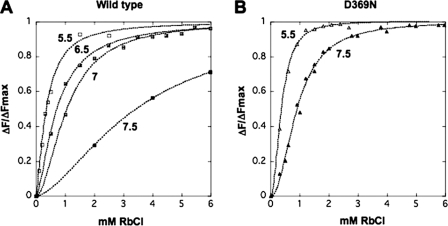
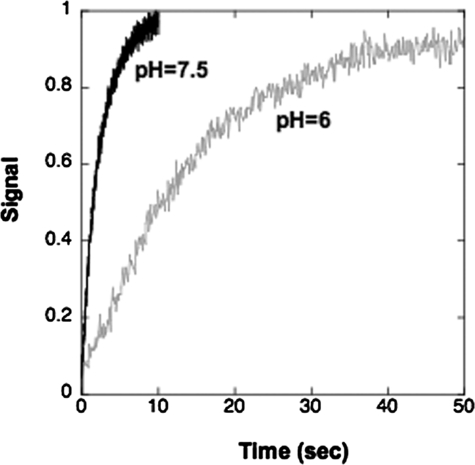
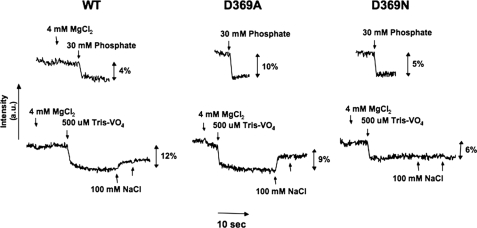
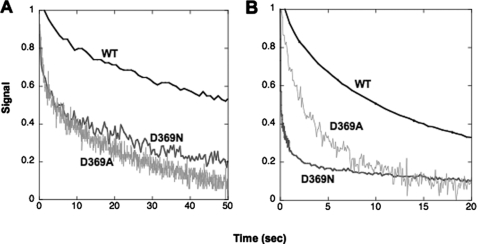
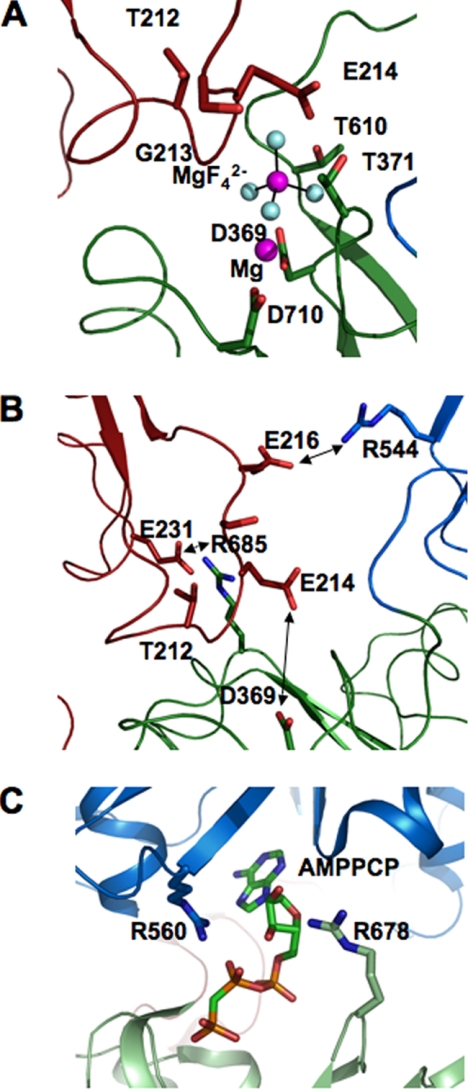
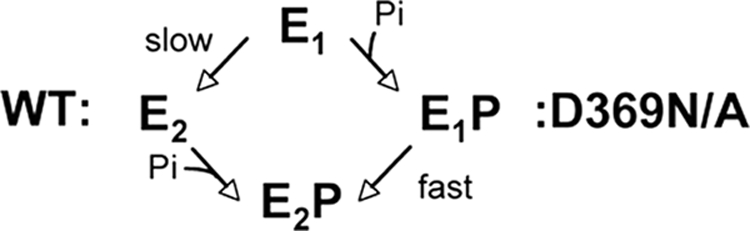
This work investigates the role of charge of the phosphorylated aspartate, Asp(369), of Na(+),K(+)-ATPase on E(1) <--> E(2) conformational changes. Wild type (porcine alpha(1)/His(10)-beta(1)), D369N/D369A/D369E, and T212A mutants were expressed in Pichia pastoris, labeled with fluorescein 5'-isothiocyanate (FITC), and purified. Conformational changes of wild type and mutant proteins were analyzed using fluorescein fluorescence (Karlish, S. J. (1980) J. Bioenerg. Biomembr. 12, 111-136). One central finding is that the D369N/D369A mutants are strongly stabilized in E(2) compared with wild type and D369E or T212A mutants. Stabilization of E(2)(Rb) is detected by a reduced K(0.5)Rb for the Rb(+)-induced E(1) <--> E(2)(2Rb) transition. The mechanism involves a greatly reduced rate of E(2)(2Rb) --> E(1)Na with no effect on E(1) --> E(2)(2Rb). Lowering the pH from 7.5 to 5.5 strongly stabilizes wild type in E(2) but affects the D369N mutant only weakly. Thus, this "Bohr" effect of pH on E(1) <--> E(2) is due largely to protonation of Asp(369). Two novel effects of phosphate and vanadate were observed with the D369N/D369A mutants as follows. (a) E(1) --> E(2).P is induced by phosphate without Mg(2+) ions by contrast with wild type, which requires Mg(2+). (b) Both phosphate and vanadate induce rapid E(1) --> E(2) transitions compared with slow rates for the wild type. With reference to crystal structures of Ca(2+)-ATPase and Na(+),K(+)-ATPase, negatively charged Asp(369) favors disengagement of the A domain from N and P domains (E(1)), whereas the neutral D369N/D369A mutants favor association of the A domain (TGES sequence) with P and N domains (E(2)). Changes in charge interactions of Asp(369) may play an important role in triggering E(1)P(3Na) <--> E(2)P and E(2)(2K) --> E(1)Na transitions in native Na(+),K(+)-ATPase.
Figures
Similar articles
-
Consequences of mutations to the phosphorylation site of the alpha-subunit of Na, K-ATPase for ATP binding and E1-E2 conformational equilibrium.Biochemistry. 1996 Dec 17;35(50):16085-93. doi: 10.1021/bi961614c. Biochemistry. 1996. PMID: 8973179
-
Expression of Na+,K+-ATPase in Pichia pastoris: analysis of wild type and D369N mutant proteins by Fe2+-catalyzed oxidative cleavage and molecular modeling.J Biol Chem. 2003 Nov 14;278(46):46064-73. doi: 10.1074/jbc.M308303200. Epub 2003 Aug 29. J Biol Chem. 2003. PMID: 12949069
-
Conformational transitions in fluorescein-labeled (Na,K)ATPase reconstituted into phospholipid vesicles.J Biol Chem. 1986 May 15;261(14):6248-54. J Biol Chem. 1986. PMID: 3009450
-
Functional domains of Na,K-ATPase; conformational transitions in the alpha-subunit and ion occlusion.Acta Physiol Scand Suppl. 1992;607:89-95. Acta Physiol Scand Suppl. 1992. PMID: 1333164 Review.
-
Structure-function relationships of Na(+), K(+), ATP, or Mg(2+) binding and energy transduction in Na,K-ATPase.Biochim Biophys Acta. 2001 May 1;1505(1):57-74. doi: 10.1016/s0005-2728(00)00277-2. Biochim Biophys Acta. 2001. PMID: 11248189 Review.
Cited by
-
FXYD proteins stabilize Na,K-ATPase: amplification of specific phosphatidylserine-protein interactions.J Biol Chem. 2011 Mar 18;286(11):9699-712. doi: 10.1074/jbc.M110.184234. Epub 2011 Jan 12. J Biol Chem. 2011. PMID: 21228272 Free PMC article.
-
Stimulation, inhibition, or stabilization of Na,K-ATPase caused by specific lipid interactions at distinct sites.J Biol Chem. 2015 Feb 20;290(8):4829-4842. doi: 10.1074/jbc.M114.611384. Epub 2014 Dec 22. J Biol Chem. 2015. PMID: 25533463 Free PMC article.
-
Do Src Kinase and Caveolin Interact Directly with Na,K-ATPase?J Biol Chem. 2016 May 27;291(22):11736-50. doi: 10.1074/jbc.M116.721084. Epub 2016 Mar 28. J Biol Chem. 2016. PMID: 27022017 Free PMC article.
-
Molecular Mechanisms and Kinetic Effects of FXYD1 and Phosphomimetic Mutants on Purified Human Na,K-ATPase.J Biol Chem. 2015 Nov 27;290(48):28746-59. doi: 10.1074/jbc.M115.687913. Epub 2015 Oct 1. J Biol Chem. 2015. PMID: 26429909 Free PMC article.
-
A structural overview of the plasma membrane Na+,K+-ATPase and H+-ATPase ion pumps.Nat Rev Mol Cell Biol. 2011 Jan;12(1):60-70. doi: 10.1038/nrm3031. Nat Rev Mol Cell Biol. 2011. PMID: 21179061 Review.
References
-
- Olesen C., Picard M., Winther A. M., Gyrup C., Morth J. P., Oxvig C., Møller J. V., Nissen P. (2007) Nature 450, 1036–1042 - PubMed
-
- Toyoshima C. (2008) Arch. Biochem. Biophys. 476, 3–11 - PubMed
-
- Toyoshima C. (2009) Biochim. Biophys. Acta 1793, 941–946 - PubMed
-
- Garty H., Karlish S. J. (2006) Annu. Rev. Physiol. 68, 431–459 - PubMed
-
- Morth J. P., Pedersen B. P., Toustrup-Jensen M. S., Sørensen T. L., Petersen J., Andersen J. P., Vilsen B., Nissen P. (2007) Nature 450, 1043–1049 - PubMed
Publication types
MeSH terms
Substances
LinkOut - more resources
Full Text Sources
Molecular Biology Databases
Miscellaneous
