. 2009 Nov 13;284(46):32015-27.
doi: 10.1074/jbc.M109.016774. Epub 2009 Sep 2.

MicroRNA-122 inhibits tumorigenic properties of hepatocellular carcinoma cells and sensitizes these cells to sorafenib

Affiliations

MicroRNA-122 inhibits tumorigenic properties of hepatocellular carcinoma cells and sensitizes these cells to sorafenib

Shoumei Bai et al. J Biol Chem. .

Abstract

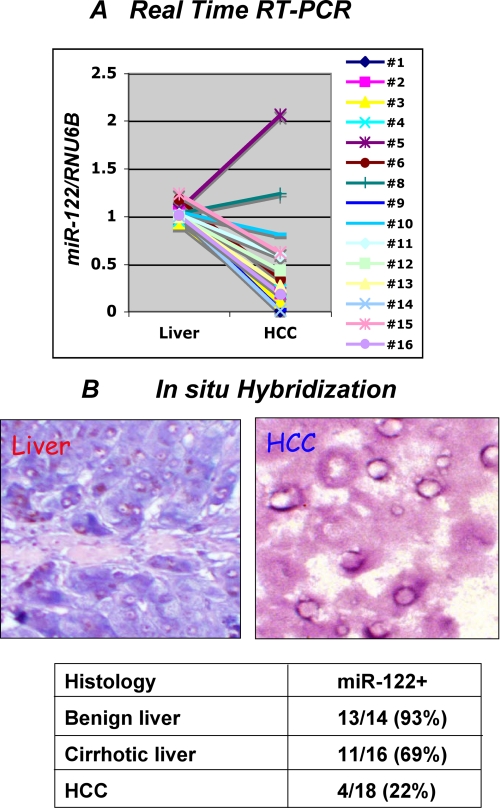
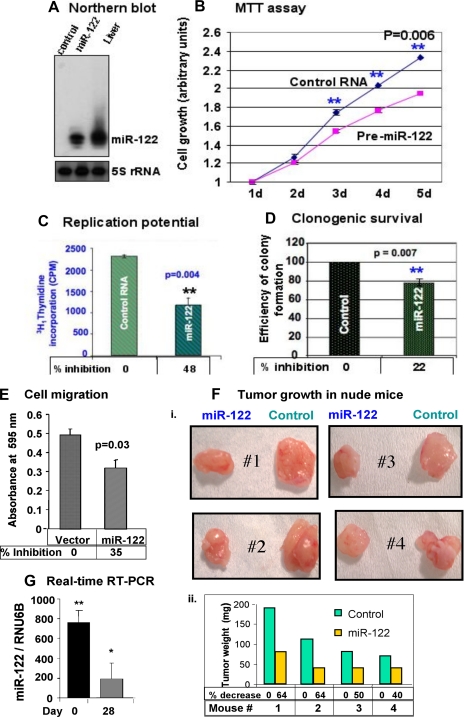
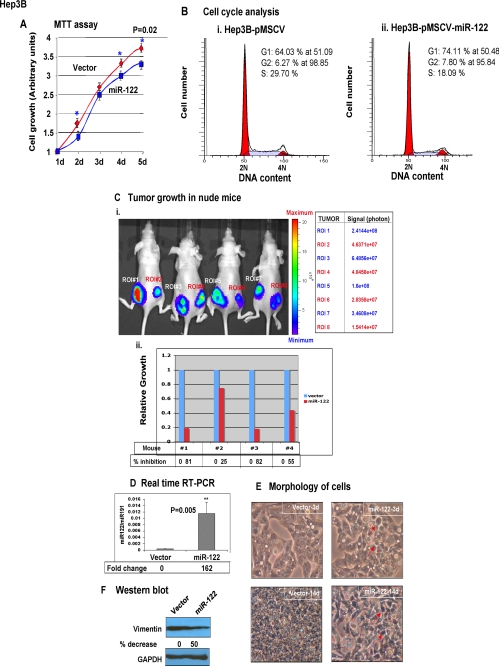
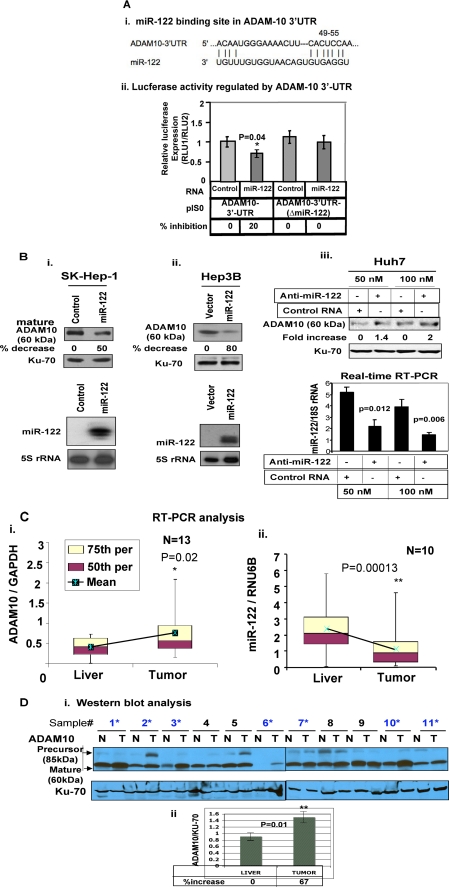
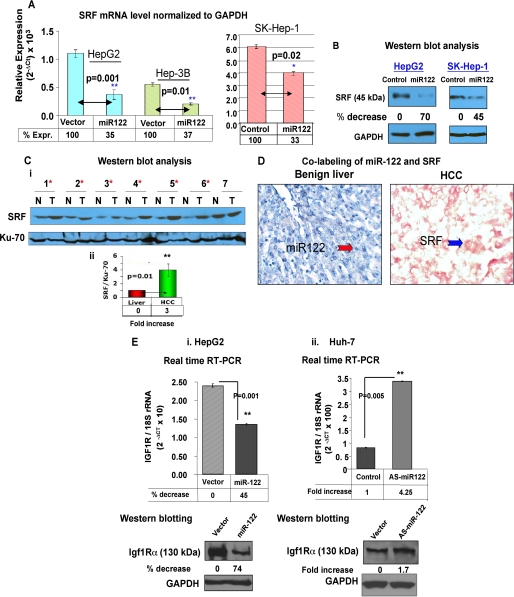
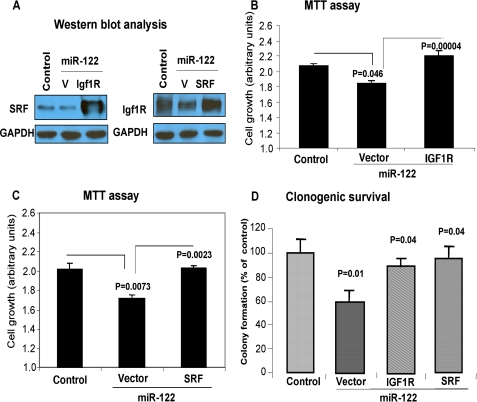
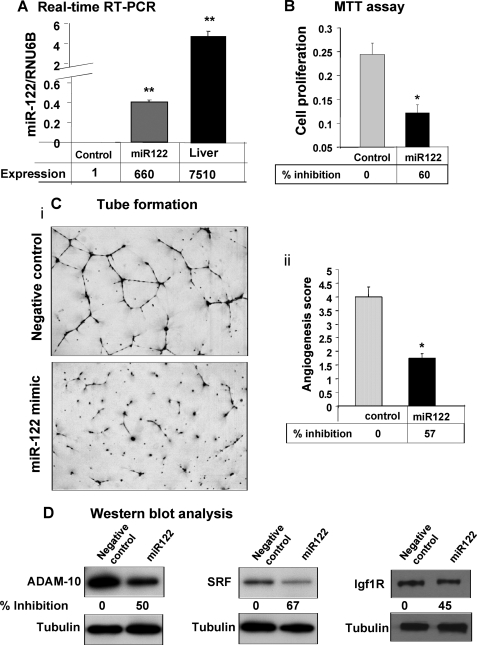
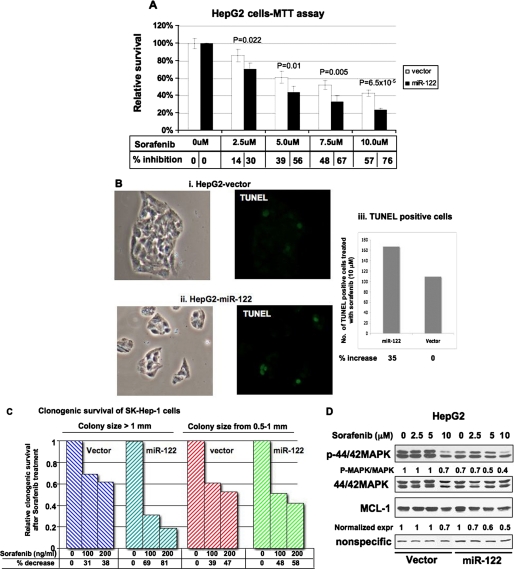
MicroRNAs are negative regulators of protein coding genes. The liver-specific microRNA-122 (miR-122) is frequently suppressed in primary hepatocellular carcinomas (HCCs). In situ hybridization demonstrated that miR-122 is abundantly expressed in hepatocytes but barely detectable in primary human HCCs. Ectopic expression of miR-122 in nonexpressing HepG2, Hep3B, and SK-Hep-1 cells reversed their tumorigenic properties such as growth, replication potential, clonogenic survival, anchorage-independent growth, migration, invasion, and tumor formation in nude mice. Further, miR-122-expressing HCC cells retained an epithelial phenotype that correlated with reduced Vimentin expression. ADAM10 (a distintegrin and metalloprotease family 10), serum response factor (SRF), and insulin-like growth factor 1 receptor (Igf1R) that promote tumorigenesis were validated as targets of miR-122 and were repressed by the microRNA. Conversely, depletion of the endogenous miR-122 in Huh-7 cells facilitated their tumorigenic properties with concomitant up-regulation of these targets. Expression of SRF or Igf1R partially reversed tumor suppressor function of miR-122. Further, miR-122 impeded angiogenic properties of endothelial cells in vitro. Notably, ADAM10, SRF, and Igf1R were up-regulated in primary human HCCs compared with the matching liver tissue. Co-labeling studies demonstrated exclusive localization of miR-122 in the benign livers, whereas SRF predominantly expressed in HCC. More importantly, growth and clonogenic survival of miR-122-expressing HCC cells were significantly reduced upon treatment with sorafenib, a multi-kinase inhibitor clinically effective against HCC. Collectively, these results suggest that the loss of multifunctional miR-122 contributes to the malignant phenotype of HCC cells, and miR-122 mimetic alone or in combination with anticancer drugs can be a promising therapeutic regimen against liver cancer.


Figures

FIGURE 1.
FIGURE 1.
Expression of miR-122 is reduced in primary HCCs. A, expression of miR-122 is significantly down-regulated in primary human HCCs compared with matching liver tissues. TaqMan RT-PCR assay using primer and probe for miR-122 and RNU6B (snRNA U6B) is shown. Each sample was analyzed in triplicate. The results are the means ± S.D. of three independent experiments. B, a representative in situ hybridization data showing miR-122 expression in the liver but not in HCC. Expression of miR-122 was detected by in situ hybridization with LNA-modified antisense miR-122 probe. Tissue sections were hybridized to biotin-labeled oligonucleotide (antisense miR-122 or scrambled), which was captured with alkaline phosphatase conjugated-streptavidin, and the signal (blue) was developed with nitro blue tetrazolium/5-bromo-4-chloro-3-indolyl phosphate. The cell nuclei were stained with fast red dye. Quantification of miR-122-positive samples in different benign, cirrhotic, and HCC samples are presented in the lower panel.
FIGURE 2.
FIGURE 2.
Expression of ectopic miR-122 inhibited tumorigenic property of SK-Hep-1 cells. A, total RNA (15 μg) from these cells was subjected to Northern blot analysis with 32P-labeled anti-miR-122 or anti-5 S rRNA oligonucleotide as probe. B, cells (1000 cells/well) were seeded in 96-well plate, and cell growth was monitored every 24 h using MTT assay. d denotes days in culture. Each cell type was analyzed in quadruplicate. Absorbance at day 1 was assigned a value of 1. The results are the means ± S.D. of three independent experiments. C, cells (10,000 cells/well of 24-well plate) were serum-starved overnight followed by addition of serum and [3H]thymidine for 2 h, and [3H]thymidine incorporated into DNA was measured in a scintillation counter. Each experiment was performed in triplicate and was repeated twice. D, anchorage-independent growth was inhibited in miR-122-expressing cells. Cells (105 in 60-mm dish) were used for soft agar assay, and colonies formed after 2 weeks were stained with crystal violet and counted. Each sample was analyzed in triplicate. Efficiency of colony formation was determined by arbitrarily assigning the colonies formed in the control as 100. E, miR-122 inhibited cell migration through trans-well inserts (8-μm pore size). Cells (1 × 10⁴) in serum-free medium layered onto the top chamber of a two chamber plate were allowed to migrate to the bottom chamber containing serum-supplemented medium for 48 h at 37 °C. The cells that migrated to the bottom of the insert were suspended in phosphate-buffered saline containing 5% acetic acid and 5% methanol, stained with Hema 3. The color developed was measured at 595 nm. Absorbance of cells that migrated to the bottom chamber containing serum-free medium was used as negative control. The results are the means ± S.D. of three experiments. F, miR-122 inhibited tumor growth in nude mice. Cells (2 × 10⁶) transfected with control RNA or miR-122 mimetic were mixed with 50% Matrigel and injected subcutaneously to the flanks of nude mice. After 4 weeks, the tumors were excised and analyzed. Panel i, photograph of tumors developed in mice. Panel ii, average weight of the tumors developed in each group. G, miR-122 expression in cells before transplantation in nude mice and in tumors developed after 4 weeks by real time RT-PCR. The data were normalized to RNU6B.
FIGURE 3.
FIGURE 3.
Ectopic expression of miR-122 inhibited tumorigenic properties of Hep3B and HepG2 cells. A, growth of Hep3B cells was measured by MTT assay as described in the legend to Fig. 2. The results are means ± S.D. of three independent experiments. B, analysis of cell cycle profile miR-122-expressing and control Hep3B cells by fluorescence-activated cell sorter analysis. Cells (1 × 10⁶) 72 h post-transfection were fixed overnight at −20 °C in 70% ethanol and washed, and incorporation of propidium iodide in cells treated with RNase A was measured in the FACSCaliber. C, tumor growth in nude mice. Hep3B cells (5 × 10⁶ in 100 μl of phosphate-buffered saline) expressing luciferase alone or along with miR-122 were injected subcutaneously to the left and right flanks, respectively, of nude mice (see “Experimental Procedures” for details). Every week (up to 3 weeks), the mice were injected with luciferin (4.2 mg in 150 μl of saline) to monitor tumor growth by imaging with an IVIS system. The scale denotes the minimum and maximum photon intensity. Panel i, photograph of tumors developed in four mice. Panel ii, luciferase signal, region-of-interest (ROI), captured in each tumor in each mouse is represented. D, real time RT-PCR analysis of miR-122 in stable HepG2-tet-off cells expressing miR-122 or the vector. miR-122 expression was normalized to miR-191. E, morphology of miR-122-expressing HepG2-tet-off cells is distinct from those transfected with the vector. An identical number (1 × 10⁶) of cells seeded in a 100-mm dish was allowed to grow for 14 days and was photographed on days 3 and 14 under a phase contrast microscope. F, Western blot analysis of Vimentin, a marker for mesenchymal cells, and GAPDH in the whole cell extracts. The Vimentin level normalized to that of GAPDH is presented.
FIGURE 4.
FIGURE 4.
ADAM10, a target of miR-122, is significantly up-regulated in primary human HCCs. A, panel i, the conserved miR-122 cognate site in 3′-UTR of ADAM10. Panel ii, luciferase activity driven by 3′-UTR of ADAM10 is inhibited by ectopic expression of miR-122. Hep3B cells were co-transfected with firefly luciferase-3′-UTR-(ADAM10) or 3′-UTR of ADAM10 deleted of miR-122 complementary site and miR-122 mimetic or control RNA (50 nm) along with pRL-TK (as an internal control) using Lipofectamine 2000. After 48 h, firefly (RLU-1) and Renilla luciferase (RLU-2) activities were measured using dual luciferase assay kit. The results represented as firefly luciferase normalized to Renilla luciferase are the means ± S.D. of quadruplicate experiments. B, cell extracts were subjected to immunoblot analysis, and the data were normalized to Ku-70. The corresponding expression of miR-122 is presented in the lower panels. Reproducible results were obtained in two independent experiments. C, ADAM10 mRNA and miR-122 were measured in HCCs and matching liver tissues by real time RT-PCR analysis. The data are presented as a box-whisker plot. The horizontal line in each box represents the median value of ADAM10 mRNA or miR-122 normalized to GAPDH or RNU6B, respectively. Boxes represent 50th and 75th percentile range of scores (as indicated), whereas the whiskers represent the highest and lowest values. D, Western blot analysis of ADAM10 in HCC and matching liver extracts. The signal in each lane was quantified using Kodak imaging software. Normalized data are presented in the lower panel.
FIGURE 5.
FIGURE 5.
SRF and Igf1R are targets of miR-122. A, SRF mRNA level in HCC cells transfected with (50 nm) control RNA or mimetic (HepG2, Hep3B, and SK-Hep-1) was measured by real time RT-PCR, and the data were normalized to GAPDH. B, SRF protein level in HCC cells expressing miR-122. Western blot analysis of SRF and GAPDH in extracts of cells transfected with control or miR-122 mimetic (50 nm). C, panel i, Western blot analysis of SRF in HCCs and matching liver tissues. Whole tissue extracts were subjected to immunoblot analysis with SRF and Ku-70 antibodies. The asterisks denote samples showing up-regulation of SRF. Panel ii, SRF level normalized Ku-70 level. D, co-labeling of miR-122 and SRF in FFP sections of primary human HCC. Tissue sections were hybridized to biotinylated and LNA-modified antisense miR-122 probe, which was captured with alkaline phosphatase conjugated-streptavidin, and the signal (blue) was developed with nitro blue tetrazolium/5-bromo-4-chloro-3-indolyl phosphate. Next, the section was subjected to immunohistochemistry with anti-SRF antibody using fast red dye as the chromogen. E, expression of Igf1R RNA (upper panels) and protein (lower panels) in cells transfected with miR-122 (in HepG2, panel i) or anti-miR-122 (in Huh-7, panel ii) by real time RT-PCR and Western blot analysis, respectively.
FIGURE 6.
FIGURE 6.
Growth inhibitory property of miR-122 could be partially reversed by co-expression of SRF or Igf1R lacking 3′-UTR. SK-Hep-1 cells expressing miR-122 or vector were co-transfected with SRF, Igf1R expression vector, or corresponding empty vector. A, 48 h later cell extracts were split for Western blot analysis. B and C, MTT assay (72 h post-transfection). D, clonogenic survival of cells (2 weeks post-transfection).
FIGURE 7.
FIGURE 7.
miR-122 inhibits growth and tube formation of endothelial cells in vitro. HDMEC cells transfected with 50 nm of miR-122 or control RNA using Lipofectamine 2000 were trypsinized, counted, and used for different assays after 24 h cells. A, miR-122 level in cells 96 h post-transfection. B, proliferation of HDMEC cells 48 h post-transfection was measured by MTT assay. C, 1.6 × 10³ cells in endothelial cell basal medium-2 supplemented with 2% serum were added to a Matrigel-coated well and incubated at 37 °C for 16–18 h. At the end of incubation, the culture medium was aspirated off the Matrigel surface, and the cells were fixed with methanol and stained with Diff-Quick solution II. Each chamber was photographed under microscope, and the total area occupied by endothelial cell derived tubes in each chamber was calculated using NIS-Elements-BS (Nikon) and expressed as an angiogenic score. D, Western blot analysis of cell lysates (72 h post-transfection) with specific antibodies. The levels of ADAM10, SRF, and Igf1R were normalized to tubulin.
FIGURE 8.
FIGURE 8.
Survival of miR-122-expressing HCC cells was significantly reduced after sorafenib treatment. A, vector-transfected and miR-122-expressing cells were seeded in a 96-well plate treated with different concentrations of sorafenib for 24 h, and cell survival was measured by MTT assay. Survival of untreated cells was taken as 100%. B, cells treated with 10 μm sorafenib for 48 h were subjected to TUNEL assay using an in situ cell death detection kit (Roche Applied Science), and positive cells in four fields at 10× magnification were counted. Panels i and ii, representative photographs of TUNEL-positive (green) and total number of cells (phase contrast). C, clonogenic survival of miR-122-expressing or vector transfected SK-Hep-1 cells in presence of sorafenib. Cells (500) were plated in a 60-mm dish followed by treatment with the drug 48 h later. Media and drugs were replaced every 72 h. The colonies were stained and counted after 10 days. D, Western blot analysis of cell extracts treated with sorafenib with different antibodies.

References

    1. El-Serag H. B., Rudolph K. L. (2007) Gastroenterology 132, 2557–2576 - PubMed
    1. Visone R., Petrocca F., Croce C. M. (2008) Gastroenterology 135, 1866–1869 - PubMed
    1. Braconi C., Patel T. (2008) Hepatology 47, 1807–1809 - PubMed
    1. Bartel D. P. (2009) Cell 136, 215–233 - PMC - PubMed
    1. Kim V. N., Han J., Siomi M. C. (2009) Nat. Rev. Mol. Cell Biol. 10, 126–139 - PubMed

Publication types

MeSH terms