. 2009 Nov 6;284(45):31363-74.
doi: 10.1074/jbc.M109.053132. Epub 2009 Sep 2.

Identification of a novel function of PiT1 critical for cell proliferation and independent of its phosphate transport activity

Affiliations

Identification of a novel function of PiT1 critical for cell proliferation and independent of its phosphate transport activity

Laurent Beck et al. J Biol Chem. .

Abstract

PiT1 is a Na(+)-phosphate (P(i)) cotransporter located at the plasma membrane that enables P(i) entry into the cell. Its broad tissue expression pattern has led to the idea that together with the closely related family member PiT2, PiT1 is the ubiquitous supplier of P(i) to the cell. Moreover, the role of P(i) in phosphorylation reactions, ATP production, DNA structure, and synthesis has led to the view that P(i) availability could be an important determinant of cell growth. However, these issues have not been clearly addressed to date, and the role of either P(i) or PiT proteins in cell proliferation is unknown. Using RNA interference in HeLa and HepG2 cells, we show that transient or stable PiT1 depletion markedly reduces cell proliferation, delays cell cycle, and impairs mitosis and cytokinesis. In vivo, PiT1 depletion greatly reduced tumor growth when engineered HeLa cells were injected into nude mice. We provide evidence that this effect on cell proliferation is specific to PiT1 and not shared by PiT2 and is not the consequence of impaired membrane Na(+)-P(i) transport. Moreover, we show that modulation of cell proliferation by PiT1 is independent from its transport function because the proliferation of PiT1-depleted cells can be rescued by non-transporting PiT1 mutants. PiT1 depletion leads to the phosphorylation of p38 mitogen-activated protein (MAP) kinase, whereas other MAP kinases and downstream targets of mammalian target of rapamycin (mTOR) remain unaffected. This study is the first to describe the effects of a P(i) transporter in cell proliferation, tumor growth, and cell signaling.


Figures

FIGURE 1.
FIGURE 1.
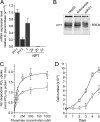
PiT1, the major Pi transporter in HeLa cells, is critical for cell proliferation. A, relative levels of Na+-Pi cotransporters (NPT) mRNAs in HeLa cells were determined by real-time PCR. PiT1 is most abundantly expressed in HeLa cells followed by that of PiT2; other NPTs are not detected. Error bars indicate S.E. B, transient inactivation of PiT1 in HeLa cells using siRNA. Proteins were extracted from HeLa cells transfected with 100 nm of the indicated siRNA, and PiT1 expression was analyzed by Western blot using anti-PiT1 antibody 48 h after transfection. C, depletion of PiT1 does not modify PiT2 expression, as measured by the relative mRNA expression levels (real-time PCR) of PiT1 (red bars) and PiT2 (blue bars) in shScramble or shPiT1 stably transfected HeLa clones. D, Pi transport was measured in transient and stable knockdown of PiT1 in HeLa cells. For transient knockdown of PiT1, HeLa cells were transfected with the indicated siRNA (10 nm) or untransfected (Untransf.), and Pi transport was determined 48 h after transfection. Stable shRNA clones were tested for Pi transport 4 days after seeding. **, p < 0.01. E, transient depletion of PiT1 reduces cell proliferation. HeLa cells were transfected with 10 nm of two different PiT1-specific siRNAs (A and B), a pool of PiT2 siRNA, or untransfected. At 72 h after transfection, cells were counted. Cell numb, cell number. *, p < 0.05. F, the proliferation of stably PiT1-depleted HeLa cells is impaired. Untransfected HeLa cells (crosses) or HeLa cells stably transfected with PiT1 shRNA (red circles) or scramble shRNA (white squares) were grown in complete medium and counted on the indicated days.
FIGURE 2.
FIGURE 2.
Anti-PiT1 antibody production and characterization. A polyclonal antibody against human PIT1 was generated as described under “Experimental Procedures.” Briefly, a 59-amino acid peptide located in the intracellular loop of PiT1 was expressed as a GST fusion protein and used for immunization. Rabbit sera were then purified from anti-GST antibodies. A, total, membranous, and cytosolic protein extracts from untransfected (Cont; 1 μg of protein extract) or hPIT1-transfected (T; 1 μg) COS7 cells, as well as untransfected HEK cells (HEK; 20 μg of protein extract), were separated by SDS-PAGE, and the blotted membrane was probed with the purified anti-PiT1 antibody (1/500). B, glycosylation of endogenous versus transfected PiT1 protein. Proteins extracts from COS7 or HEK cells were treated (+) with 500 units of (PNGaseF) for 1 h at 37 °C or not treated (−) and then separated by SDS-PAGE, and the blotted filter was probed with the purified anti-PiT1 antibody (1/500). C, extracts from COS7 cells transfected with hPIT1-V5 were separated by SDS-PAGE, and the membranes were immunoblotted (IB) with either the anti-PiT1 (1/500) or the anti-V5 antibody (1/5000), as indicated. D, GST-PiT1 peptide used for immunization and an unrelated fusion peptide (GST-klotho) were separated by SDS-PAGE, and the blots were hybridized with immune serum or purified antibody, as indicated. E, competition with the immunogen peptide. Extracts from HEK cells (50 and 20 μg) were separated by SDS-PAGE, and the blotted filters were probed with anti-PiT1 (1/1000) antibody, which was preincubated for 1 h at room temperature with or without 0.5 μg of GST-PiT1 peptide, as indicated.
FIGURE 3.
FIGURE 3.
Inactivation of PiT1 and PiT2 in HeLa cells using RNAi. A and B, transient inactivation of PiT1 (A) and PiT2 (B) using siRNA. RNA was extracted from untransfected, Lipofectamine control (no siRNA), siControl-transfected (100 nm), and siPiT1-transfected or siPiT2-transfected (1, 10, and 100 nm) HeLa cells. The effect of RNA interference was analyzed by Northern blot using PiT1, PiT2, and actin probes, as indicated. C, total proteins were extracted from untransfected, Lipofectamine control (no siRNA), siControl-transfected (100 nm), and siPiT1-transfected (1, 10, and 100 nm) HeLa cells. PiT1 expression was analyzed by Western blot using anti-PiT1 and anti-actin antibodies, as indicated. D, stable knockdown of PiT1 in HeLa cells using shRNA. Proteins from HeLa cells were extracted from untransfected (NT) cells or clones stably transfected with shScramble or shPiT1 in pSUPER vector, as indicated. PiT1 and actin expression were analyzed by Western blot using anti-PiT1 and anti-actin antibodies, as indicated. E, analysis of PiT1 expression in stably transfected shScramble and shPiT1 HeLa cells by indirect immunofluorescence. Cells were fixed, stained with propidium iodide, and labeled using an anti-PiT antibody and a secondary antibody coupled to fluorescein isothiocyanate. Confocal x-y sections of HeLa cells were taken, as indicated.
FIGURE 4.
FIGURE 4.
Knockdown of PiT1 in HepG2 cells leads to reduced Pi transport and impaired proliferation. A, relative levels of NPT mRNAs in HepG2 cells using real-time RT-PCR reveals that PiT1 and NPT1 transporters are most abundantly expressed in HepG2 cells followed by that of PiT2; other NPTs are not significantly detected. Error bars indicate S.E. B, stable knockdown of PiT1 in HepG2 cells using shRNA. Proteins from HepG2 cells were extracted from untransfected cells (HepG2) or clones stably transfected with shScramble or shPiT1 in pSUPER vector, as indicated. PiT1 expression was analyzed by Western blot using anti-PiT1 antibody. C, Na+-dependent Pi uptake in shScramble (square) and shPiT1 (circle) HepG2 cells were calculated by subtracting uptake measured under Na+-free conditions from that observed in the presence of Na+ at each KH2PO4 concentration. D, HepG2 cells were grown in complete medium, stably transfected with shScramble (square), or shPiT1 (circle), and proliferation was assessed by counting the cells on the indicated days.
FIGURE 5.
FIGURE 5.
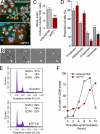
Impaired cytokinesis and delayed cell cycle in PiT1-deprived HeLa cells. A, Hoechst staining of HeLa cells in culture demonstrates polyploidic nucleus, increased cell size, and numerous lagging chromosomes (arrows) in shPiT1 HeLa cells. B, representative images of live cell imaging of shPiT1 HeLa cells. Cells were followed from prophase until the completion of mitosis. Note the failure of cytokinesis leading to a binucleated cell (triangle). The cell noted with the asterisk serves as a control. C, mitotic index of asynchronous mitotic PiT1-depleted HeLa cells was reduced by half. **, p < 0.01. D, mitotic figures were characterized by an increase of cells in metaphase and aberrant figures of anaphase and telophase (hatched black bars). Error bars indicate S.E. *, p < 0.05, **, p < 0.01. E, FACS analysis of HeLa cells transiently depleted from PiT1. Cells were transiently transfected with 10 nm control (upper graph) or PiT1 (lower graph) siRNA. Forty-eight hours after transfection, asynchronous cells were stained with propidium iodide, and their DNA content was determined by FACS analysis. The percentages of cells in the respective phases are shown. F, entry in G2/M phase was delayed in shPiT1 HeLa cells, as measured from cell populations synchronized at G1/S by double thymidine block.
FIGURE 6.
FIGURE 6.
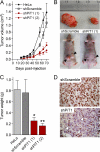
PiT1 depletion in HeLa cells reduces tumor growth in nude mice. Subcutaneous injection of stably transfected shPiT1 HeLa cells in nude mice (5 × 10⁶ cells) resulted in tumor formation at a similar occurrence as shScramble HeLa cells, but the tumor growth rate (A), tumor size (B), tumor weight (C), and proportion of PCNA-positive cells in tumor sections (D) at sacrifice time (70 days after implantation) were severely reduced. *, p < 0.05, **, p < 0.01. Error bars indicate S.E.
FIGURE 7.
FIGURE 7.
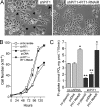
RNAi-resistant PiT1 mutants rescue cell morphology, proliferation, and transport of PiT1-depleted HeLa cells. Stable expression of a siRNA cleavage-resistant version of PiT1 (PiT1-RNAiR) in stably transfected shPiT1 HeLa cells rescues normal cell morphology (A), cell proliferation (B), and Na+-Pi transport across the cell membrane (C). *, p < 0.05, **, p < 0.01. Error bars indicate S.E.
FIGURE 8.
FIGURE 8.
Reduced proliferation following PiT1 inactivation is independent from Na+-Pi transport. A, stable expression of a PiT2-expressing plasmid in shPiT1 HeLa cells is unable to rescue the proliferation of PiT1-depleted cells to a normal value. Error bars indicate S.E. B, when serine at position 128 was replaced with an alanine by site-directed mutagenesis, the mutated version of PiT1 was unable to transport Pi. On the contrary, expression of PiT2 leads to a 2–3-fold increase in the Na+-Pi transport activity. C, transfection of the transport-deficient S128A-PiT1-RNAiR mutant in shPiT1-depleted cells rescues the cell proliferation rate, whereas overexpression of PiT2 does not. **, p < 0.01.
FIGURE 9.
FIGURE 9.
Increased phosphorylation status of p38 MAPK in PiT1-depleted HeLa cells. Proteins from HeLa cells were extracted from control (siControl or shScramble) and cells transfected with siRNAs or shRNAs, as indicated. Western blotting was performed using antibodies as indicated. A, the phosphorylation (indicated by P) of partners of the S6K/mTOR pathway in PiT1 or PiT2 transiently depleted cells following serum starvation and refeeding by FBS or 10 nm epidermal growth factor, was unchanged. B, similarly, no change was observed in the phosphorylation of ERK, c-Raf, 14-3-3σ, or JNK proteins after stimulation of PiT1-depleted HeLa cells with 10 nm epidermal growth factor (EGF) or 10% FBS. C, on the contrary, p38 was more phosphorylated in PiT1-depleted cells using two different siRNAs, either in basal conditions (left) or following 16 h of starvation and 30 min of refeeding by 10% FBS (right).
FIGURE 10.
FIGURE 10.
The serine 128 and 621 mutants of PiT1 are correctly expressed in HeLa cells. A, putative topological model for human PIT1. Transmembrane domains were assigned using the TmPred algorithm and according to Refs. and . Serine residues important for PiT1 transport function are depicted in red. Other residues (Asp-43, Glu-70, Asp-534, and Glu-603) indicated in blue are conserved residues corresponding to those that have been shown to be essential for transport function of PiT2 (31, 38) but have not been investigated for PiT1 transport function. Conserved GANDVANA signature sequences critical for transport (31) are indicated in light blue. Light green shading indicates the region important for GALV binding (39). Yellow shading indicates the regions that are not present in members of the PiT family from plants and bacteria. Extensive discussion on PiT topology can be found in Refs. and . Ext., extracellular; Int., intracellular. B, stable expression of a cleavage-resistant version of PiT1 (PiT1-RNAiR) in shPiT1 HeLa cells. Immunofluorescence on living cells shows that S128A and S621A mutants of PiT1 are expressed at the plasma membrane of HeLa cells. C, Western blot analysis of serine mutants of PiT1 shows that they are expressed at a level comparable with the parent version of PiT1.

Similar articles

Cited by

References

    1. Saier M. H., Jr. (2000) Microbiol. Mol. Biol. Rev. 64, 354–411 - PMC - PubMed
    1. Werner A., Kinne R. K. (2001) Am. J. Physiol. Regul. Integr. Comp. Physiol. 280, R301–R312 - PubMed
    1. O'Hara B., Johann S. V., Klinger H. P., Blair D. G., Rubinson H., Dunn K. J., Sass P., Vitek S. M., Robins T. (1990) Cell Growth Differ. 1, 119–127 - PubMed
    1. Miller D. G., Edwards R. H., Miller A. D. (1994) Proc. Natl. Acad. Sci. U.S.A. 91, 78–82 - PMC - PubMed
    1. Kavanaugh M. P., Miller D. G., Zhang W., Law W., Kozak S. L., Kabat D., Miller A. D. (1994) Proc. Natl. Acad. Sci. U.S.A. 91, 7071–7075 - PMC - PubMed

Publication types

MeSH terms

Substances