. 2009 Sep;119(9):2663-77.
doi: 10.1172/JCI37691. Epub 2009 Aug 24.

Six1 expands the mouse mammary epithelial stem/progenitor cell pool and induces mammary tumors that undergo epithelial-mesenchymal transition

Affiliations

Six1 expands the mouse mammary epithelial stem/progenitor cell pool and induces mammary tumors that undergo epithelial-mesenchymal transition

Erica L McCoy et al. J Clin Invest. 2009 Sep.

Abstract

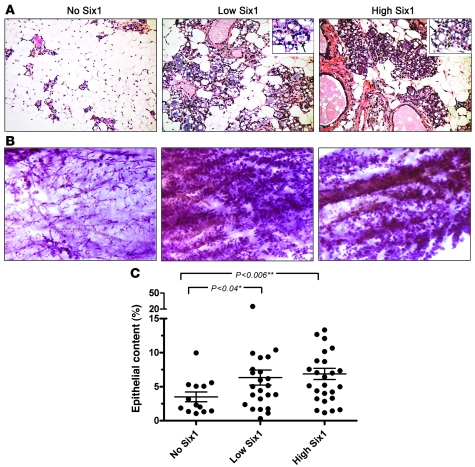
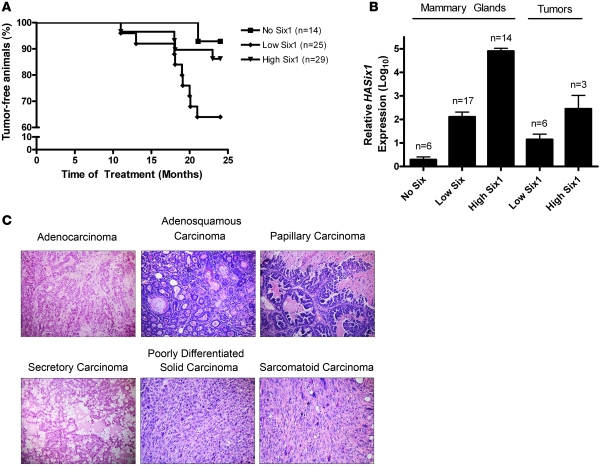
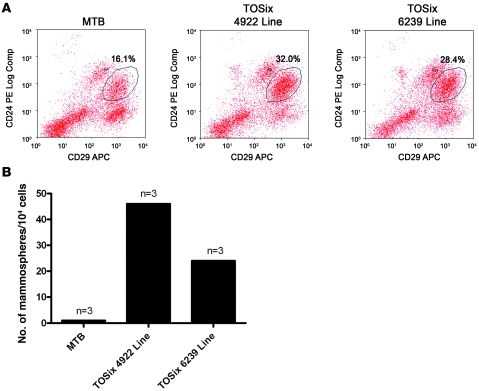
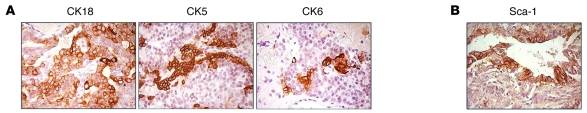
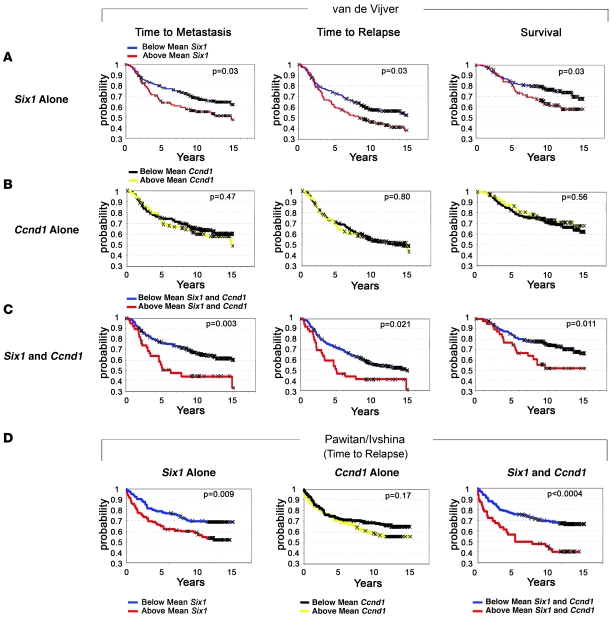
Six1 is a developmentally regulated homeoprotein with limited expression in most normal adult tissues and frequent misexpression in a variety of malignancies. Here we demonstrate, using a bitransgenic mouse model, that misexpression of human Six1 in adult mouse mammary gland epithelium induces tumors of multiple histological subtypes in a dose-dependent manner. The neoplastic lesions induced by Six1 had an in situ origin, showed diverse differentiation, and exhibited progression to aggressive malignant neoplasms, as is often observed in human carcinoma of the breast. Strikingly, the vast majority of Six1-induced tumors underwent an epithelial-mesenchymal transition (EMT) and expressed multiple targets of activated Wnt signaling, including cyclin D1. Interestingly, Six1 and cyclin D1 coexpression was found to frequently occur in human breast cancers and was strongly predictive of poor prognosis. We further show that Six1 promoted a stem/progenitor cell phenotype in the mouse mammary gland and in Six1-driven mammary tumors. Our data thus provide genetic evidence for a potent oncogenic role for Six1 in mammary epithelial neoplasia, including promotion of EMT and stem cell-like features.


Figures

Figure 1
Figure 1. Characterization of the inducible, mammary-specific Six1 transgenic mouse model.
(A) Schematic representation of the inducible, bitransgenic mouse model system. Tet-O, tet operator. (B) Southern blot analysis shows varying copy numbers in TetSix animal lines (4910, 4922, 6239, and 6245) as compared with spiked-plasmid control. (C) qPCR, using transgene-specific primers and probe, reveals that HASix1 is not expressed in the MTB +dox control animals but is expressed at low levels in the uninduced TOSix mammary glands and at high levels in the induced TOSix mammary glands. Differences in expression between –dox and +dox mammary glands are much greater than differences between transgenic lines (4922 and 6239). Values were transformed using log10(value+1) equation and plotted using a linear axis. Each point represents the value for 1 mammary gland. The middle horizontal lines represent the mean, and error bars represent mean ± SEM. Analysis was performed on multiparous animals. (D) Immunohistochemistry using Six1 antibody reveals no Six1 protein in the control MTB +dox mammary glands (No Six1), low levels of protein in the TOSix –dox mammary glands (Low Six1), and higher levels of Six1 protein in the TOSix +dox mammary glands (High Six1) (scale bar: 100 μm; original magnification, ×40). Clear nuclear staining is shown in insets at higher magnification (arrows) (original magnification, ×100).
Figure 2
Figure 2. Six1 overexpression leads to hyperplasia and precocious alveolar development.
(A) H&E-stained mammary gland sections show lipid droplets and alveolar expansion in low Six1– and high Six1–expressing animals, as compared with no Six1 controls (original magnification, ×20). Higher power insets show lipid droplets in mammary alveoli (arrows) in both low Six1 and high Six1 mammary glands (original magnification, ×63). (B) Mammary whole-mount analysis confirms diffuse hyperplasia in low Six1– and high Six1–expressing animals as compared with no Six1 animals (original magnification, ×1.25). (C) Quantification of epithelial versus fat and stromal content taken from scanned H&E-stained mammary gland sections from no Six1, low Six1, and high Six1 animals. Each point represents quantification of 1 mammary gland. The middle horizontal lines represent the mean, and error bars represent mean ± SEM.
Figure 3
Figure 3. Mammary tumors arise in Six1-expressing animals in a dose-dependent manner and manifest histologically diverse phenotypes.
(A) Kaplan-Meier analysis of the percentage of tumor-free animals reveals that both low Six1– and high Six1–expressing animals develop tumors, and tumor frequency is higher in low Six1–expressing animals. (B) Transgene-specific qPCR analysis of mammary glands and tumors taken from TOSix and control animals reveal that HASix1 expression is lower in tumors than mammary glands (including glands contralateral to tumors) but higher than that observed in control MTB +dox (no Six1) mammary glands. Values were transformed using log10(value+1) equation and plotted using a linear axis. Error bars represent mean ± SEM. Analysis was performed on multiparous animals. (C) Representative images of H&E-stained tumor sections, demonstrating various histological patterns of tumors observed in TOSix animals (original magnification, ×20).
Figure 4
Figure 4. A subset of Six1 tumors show a complete EMT.
(A) H&E-stained sections of regions of tumor showing epithelial and sarcomatoid (spindle cell) morphology. (B) Immunohistochemistry with E-cadherin antibody shows strong cell-surface staining in the epithelial regions and complete absence of staining in the sarcomatoid regions. (C) Immunohistochemistry to detect the EMT marker SMA shows a gain of SMA expression in the sarcomatoid regions. (D) Immunohistochemistry performed using an antibody against the luminal epithelial marker CK18. Sarcomatoid tumors retain cytokeratin expression, supporting an epithelial origin. Original magnification, ×40 (AD).
Figure 5
Figure 5. Wnt target genes are increased in the majority of Six1-driven tumors.
(A) Immunohistochemistry of serial sections from a TOSix mammary tumor shows area of concurrent and focal loss of E-cadherin, gain of nuclear and cytoplasmic β-catenin, and gain of the β-catenin transcriptional target, cyclin D1 (denoted by dotted line) (original magnification, ×63). (B) qPCR analysis of Wnt signaling transcriptional target expression, including Ccnd1, c-Myc, Axin2, and Tcf7 and (C) the cytoskeletal organizer, Ezr, in mammary glands taken from no Six1, low Six1–, and high Six1–expressing animals verses tumors arising in multiparous TOSix animals. Error bars represent mean ± SEM. ***P < 0.001, **P < 0.01, *P < 0.05; #, no significance.
Figure 6
Figure 6. Six1-overexpressing mammary glands exhibit stem/progenitor cell characteristics.
(A) Flow cytometric analysis of mammary epithelial cells harvested from sucrose-treated, nulliparous TOSix animals (4922 and 6239 lines) and MTB animals aged approximately 1.5 years. Three animals were pooled for each group. Antibodies used to perform flow cytometry include CD24 and CD29, markers found on mammary epithelial stem cells. TOSix animals have substantially more stem cells than MTB controls. Percentages denote the CD29hiCD24+ population. APC, allophycocyanin. (B) Secondary mammosphere assays were performed using mammary epithelial cells isolated from the above groups. Mammosphere numbers are increased in TOSix animals compared with MTB controls. Experiments in A and B were repeated with mammary epithelial cells from either sucrose- or dox-treated animals, yielding similar results.
Figure 7
Figure 7. Six1-driven tumors display features of stem/progenitor cell origin.
(A) Immunohistochemistry of sections from a single TOSix mammary tumor with activated Wnt signaling displays mixed expression of cytokeratins marking different cell types, including CK18, which is expressed on luminal epithelial cells; CK5, which is expressed on myoepithelial cells; and CK6, which is expressed on the surface of mammary progenitor cells. (B) Immunohistochemistry of a section from a TOSix tumor that expresses the mammary progenitor cell marker, Sca-1. Original magnification, ×63 (A and B).
Figure 8
Figure 8. Anti-Six1 and anti-cyclin D1 immunoreactivity correlate in human breast cancers.
(A) Breast tumor tissue microarrays were subjected to immunohistochemistry using antibodies against Six1 and cyclin D1. They were then scored for staining intensity on a 0–4 scale. Representative examples are shown of tumor cores with low-intensity Six1 staining ([scored 0–1], core number AA6), medium-intensity Six1 staining ([scored 1.5–2.5], core number DB6), and high-intensity Six1 staining ([scored 3–4], core number DB8), with their corresponding intensity of cyclin D1 staining (original magnification, ×40). (B) The intensity of cyclin D1 staining increases with increasing intensity of Six1 staining, as scored on a 0–4 scale. Six1 staining intensity groups were established as described in A. Error bars represent mean ± SEM.
Figure 9
Figure 9. Six1 overexpression significantly correlates with poor clinical outcome in breast cancers, and this significance is increased by coexpression of Ccnd1.
(A) In a study of 295 women with early-stage invasive breast carcinoma (45), high Six1 expression is associated with shortened time to metastasis, shortened time to relapse, and shortened breast cancer–specific survival (survival) (48). (B) In the same dataset, Ccnd1 overexpression alone does not correlate with shortened time to metastasis or relapse, or with shortened survival. (C) When Six1 and Ccnd1 are both overexpressed, their correlation to clinical parameters is exacerbated and the significance for poor prognosis is increased. (D) In a study of 240 patients diagnosed with invasive breast cancer of any stage (Pawitan and Ivshina) (46, 47), high Six1 expression is strongly associated with shortened time to relapse (48). Ccnd1 overexpression alone has no correlation with shortened time to relapse. When Six1 and Ccnd1 are both overexpressed, their correlation to shortened time to relapse is more significant. In both of these datasets, the mean value for Six1 and Ccnd1 expression in human breast cancers was used to divide the patients into high (above mean) and low (below mean) Six1– and Ccnd1–expressing animals.

Comment in

References

    1. Samuel S., Naora H. Homeobox gene expression in cancer: insights from developmental regulation and deregulation. Eur. J. Cancer. 2005;41:2428–2437. doi: 10.1016/j.ejca.2005.08.014. - DOI - PubMed
    1. Pearson J.C., Lemons D., McGinnis W. Modulating Hox gene functions during animal body patterning. Nat. Rev. Genet. 2005;6:893–904. doi: 10.1038/nrg1726. - DOI - PubMed
    1. Fidler I.J. The pathogenesis of cancer metastasis: the ‘seed and soil’ hypothesis revisited. Nat. Rev. Cancer. 2003;3:453–458. doi: 10.1038/nrc1098. - DOI - PubMed
    1. Brabletz T., Jung A., Spaderna S., Hlubek F., Kirchner T. Opinion: migrating cancer stem cells - an integrated concept of malignant tumour progression. Nat. Rev. Cancer. 2005;5:744–749. doi: 10.1038/nrc1694. - DOI - PubMed
    1. Guarino M., Rubino B., Ballabio G. The role of epithelial-mesenchymal transition in cancer pathology. Pathology. 2007;39:305–318. doi: 10.1080/00313020701329914. - DOI - PubMed

Publication types

MeSH terms

Substances