. 2009 Sep 3;4(9):e6886.
doi: 10.1371/journal.pone.0006886.

Immunobiological outcomes of repeated chlamydial infection from two models of within-host population dynamics

Affiliations

Immunobiological outcomes of repeated chlamydial infection from two models of within-host population dynamics

David M Vickers et al. PLoS One. .

Abstract

Background: Chlamydia trachomatis is a common human pathogen that mediates disease processes capable of inflicting serious complications on reproduction. Aggressive inflammatory immune responses are thought to not only direct a person's level of immunity but also the potential for immunopathology. With human immunobiology being debated as a cause of prevailing epidemiological trends, we examined some fundamental issues regarding susceptibility to multiple chlamydial infections that could have implications for infection spread. We argue that, compared to less-frequent exposure, frequent exposure to chlamydia may well produce unique immunobiological characteristics that likely to have important clinical and epidemiological implications.

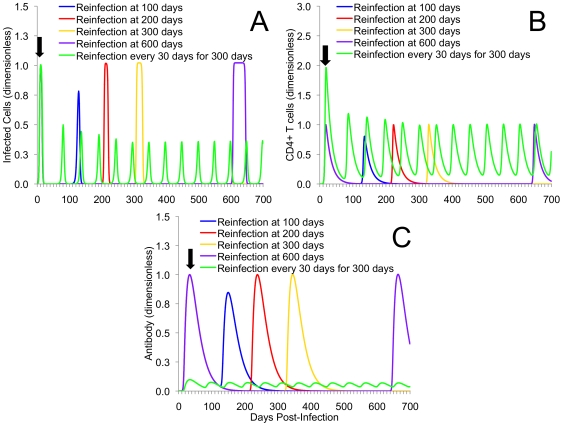
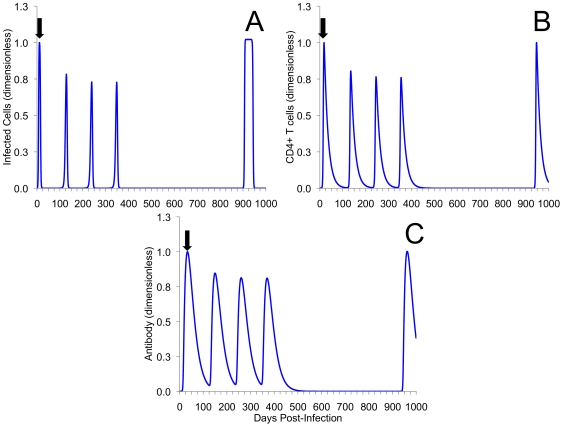
Methods and results: As a novel tool for studying chlamydia, we applied principles of modeling within-host pathogen dynamics to enable an understanding of some fundamental characteristics of an individual's immunobiology during multiple chlamydial infections. While the models were able to reproduce shorter-term infection kinetics of primary and secondary infections previously observed in animal models, it was also observed that longer periods between initial and second infection may increase an individual's chlamydial load and lengthen their duration of infectiousness. The cessation of short-term repeated exposure did not allow for the formation of long-lasting immunity. However, frequent re-exposure non-intuitively linked the formation of protective immunity, persistent infection, and the potential for immunopathology.

Conclusions: Overall, these results provide interesting insights that should be verified with continued study. Nevertheless, these results appear to raise challenges for current evidence of the development of long-lasting immunity against chlamydia, and suggest the existence of a previously unidentified mechanism for the formation of persistent infection. The obvious next goal is to investigate the qualitative impact of these results on the spread of chlamydia.


Conflict of interest statement

Competing Interests: The authors have declared that no competing interests exist.

Figures

Figure 1
Figure 1. Stock and flow diagram illustrating the assumptions about chlamydial dynamics in the models.
Displayed is a schematic representation of equations 1–5 in the main text. Uninfected ECs (X) are produced at a constant rate, λ, and die at a rate δX. Infected cells (Y) are produced at a rate βXE by contact with free EBs (E), and die at a rate αY. CD4+ T cells (Z) proliferate and differentiate at a rate cY and die at a rate σZ. Infected cells recover from infection at a rate γZY. Antibody (U) is produced at a rate ξZ. Antibodies decay at a rate ηU, neutralize EBs at a rate kUE, and are consumed in an EB-antibody complex at a rate formula image 
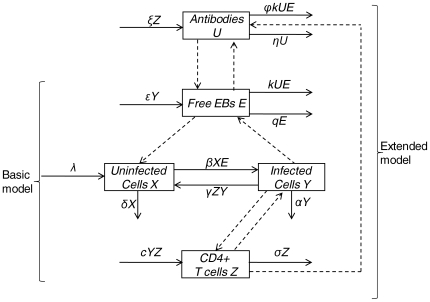
kUE. Basic and extended models are labeled by curved braces. Dashed arrows between state variables indicate interactions between them.
Figure 2
Figure 2. A comparison of experimental and simulated kinetics of primary chlamydia infection and CD4+ T cell responses.
(A) Experimental data for infected cells and T cells at initial infection. Data are modified from Igietseme and Rank . Female guinea pigs were infected with the same amount of Guinea Pig Inclusion Conjuntivitis (GPIC) chlamydia bacteria. (B) Simulated behavior of infected cells (Y) and CD4+ T cells (Z) for the basic model demonstrates similar qualitative behaviour when calibrated to approximate part (A). While both basic and extended models reproduced experimental behaviour, only the results of the basic model are displayed. For comparison of qualitative behaviour, both experimental and simulated data for infected cells and T cells have been scaled and are displayed non-dimensionally.
Figure 3
Figure 3. Secondary challenge experiments using the basic and extended models.
Re-exposure was modeled by an instantaneous inflow of EBs at each of the above-described times using a multiple of the initial infectious dose, 10×E(0) for both the basic model (A), and the extended model (B). In both panels, second infection is decreased in severity because of some residual population of T cells (A) or both T cells and antibody (B). The magnitude and time evolution of the system of equations in both (A) and (B) have been rescaled (i.e., are presented non-dimensionally) so to allow for a visual comparison. Because of structural differences, the reference categories used for scaling were different between basic and extended models. Black arrow indicates time point of secondary exposure and CD4+ T cells and antibody are plotted on the right axis.
Figure 4
Figure 4. Multiple re-exposure experiments using the basic model.
Displayed are the kinetics of infected cells (A), and CD4+ T cells (B) for single reinfection at either 100, 200, 300, or 600 days after initial infection in the basic model. Also included is the simulated kinetics of frequent re-exposure every 30 days over a span of 300 days after initial infection. As time of second infection occurs at increasingly long intervals from initial infection, the magnitude of infection and immune responses increases. For frequent re-exposure, it should be noted that oscillatory behavior continued after the removal of further infection. Single and multiple re-exposure scenarios are used to represent individuals that have low and high sexual exposure to chlamydia, respectively. Black arrow indicates point of initial infection (common to all scenarios). The magnitude and time evolution of the system of equations in both (A) and (B) are presented non-dimensionally.
Figure 5
Figure 5. Multiple re-exposure experiments using the extended model.
Displayed are the kinetics of infected cells (A), CD4+ T cells (B), and chlamydia-specific antibody (C) for single reinfection at either 100, 200, 300, or 600 days after initial infection in the extended model. Also included is the simulated kinetics of frequent re-exposure every 30 days over 300 days after initial infection under antibody deficiency. As time of second infection occurs at increasingly long intervals from initial infection, the magnitude of infection and immune responses increases. It should be noted that, for frequent re-exposure scenarios oscillatory behavior occurred once a deficiency in antibody is created, and they continue once infection pressure is removed. This demonstrates the dominance of a critical negative feedback antibody levels have on controlling reinfection. Black arrow indicates point of initial infection (common to all scenarios). For parts (B) and (C), initial immune cell levels are higher (part B) and lower (part C) at initial infection because of imposed antibody deficiency. The magnitude and time evolution of the system of equations in both (A), (B), and (C) are presented non-dimensionally.
Figure 6
Figure 6. Higher initial re-exposure followed by a long period of no exposure.
Displayed is the kinetics of infected cells (A), CD4+ T cells (B), and chlamydia-specific antibody (C) for the extended model with re-exposure every 100 days over a span of 300 days followed by single re-exposure 900 days after initial infection. With some level of pre-existing ‘immunity’ reinfection is demonstrated to be less severe. However, once infection pressure is removed, and immunity is allowed to wane, reinfection closely resembles initial infection. These scenarios were used to represent higher initial rates of exposure, between 100 and 300 days, followed by low exposure between 300 and 900 days. Black arrow indicates point of initial infection. The magnitude and time evolution of the system of equations in both (A), (B), and (C) are presented non-dimensionally.

References

    1. Bavoil PM, Hsia R, Ojcius DM. Closing in on Chlamydia and its intracellular bag of tricks. Microbiol. 2000;146:2723–2731. - PubMed
    1. Brunham RC, Rey-Ladino J. Immunology of chlamydia infection: implications for a chlamydia vaccine. Nat Rev Immunol. 2005;5:149–161. - PubMed
    1. Morrison RP, Caldwell HD. Immunity to murine chlamydial genital infection. Infect Immun. 2002;70:2741–2751. - PMC - PubMed
    1. Rank RG, Batteiger BE, Soderberg LSF. Susceptibility to reinfection after a primary chlamydial genital infection. Infect Immun. 1988;56:2243–2249. - PMC - PubMed
    1. Igietseme JU, Rank RG. Susceptibility to reinfection after a primary chlamydial genital infection is associated with a decrease of antigen-specific T cells in the genital tract. Infect Immun. 1991;59:1346–1351. - PMC - PubMed

Publication types

Substances