. 2009 Sep 3:3:86.
doi: 10.1186/1752-0509-3-86.

Large-scale analysis of Arabidopsis transcription reveals a basal co-regulation network

Affiliations

Large-scale analysis of Arabidopsis transcription reveals a basal co-regulation network

Osnat Atias et al. BMC Syst Biol. .

Abstract

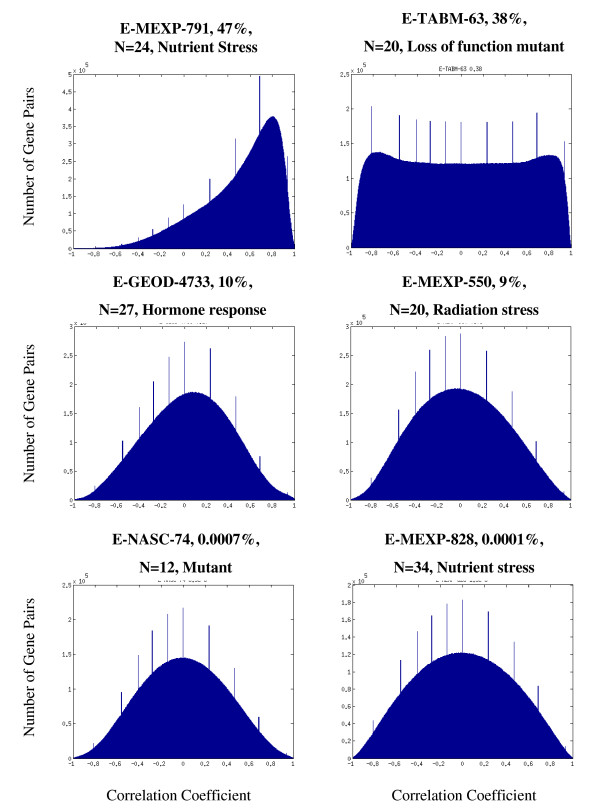
Background: Analyses of gene expression data from microarray experiments has become a central tool for identifying co-regulated, functional gene modules. A crucial aspect of such analysis is the integration of data from different experiments and different laboratories. How to weigh the contribution of different experiments is an important point influencing the final outcomes. We have developed a novel method for this integration, and applied it to genome-wide data from multiple Arabidopsis microarray experiments performed under a variety of experimental conditions. The goal of this study is to identify functional globally co-regulated gene modules in the Arabidopsis genome.

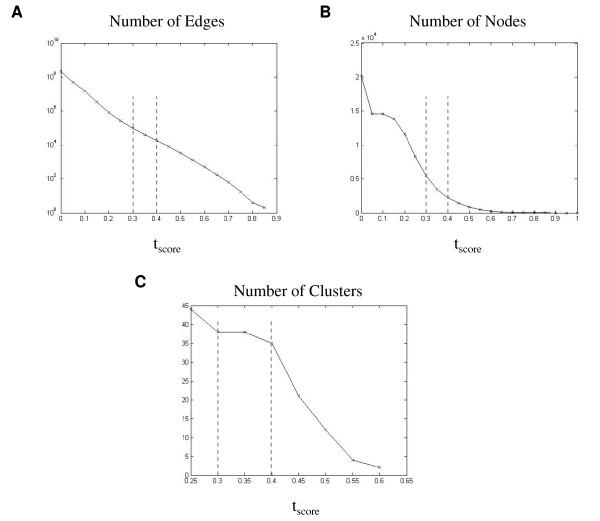
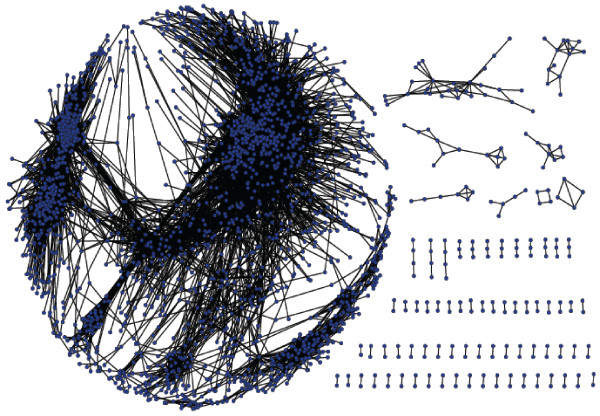
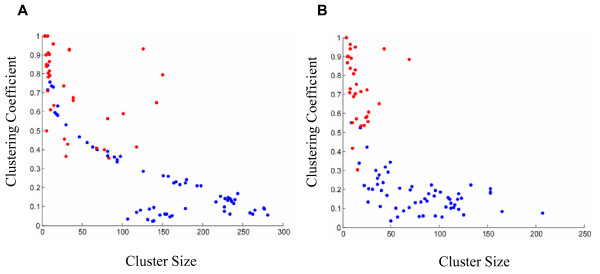
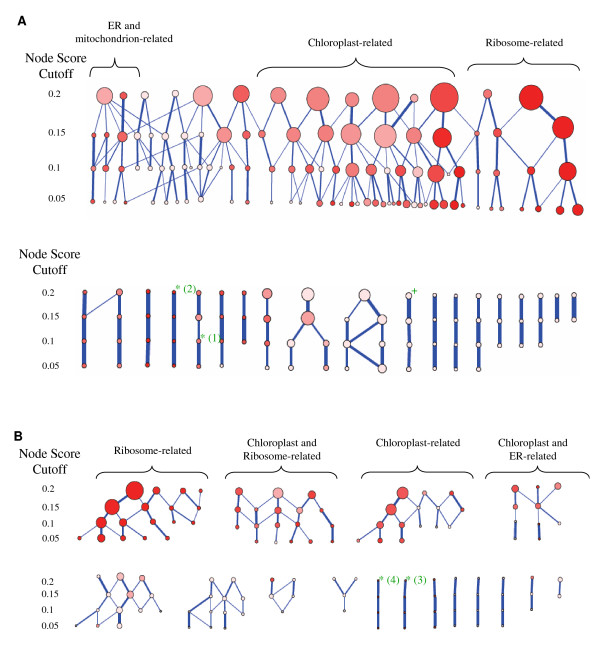
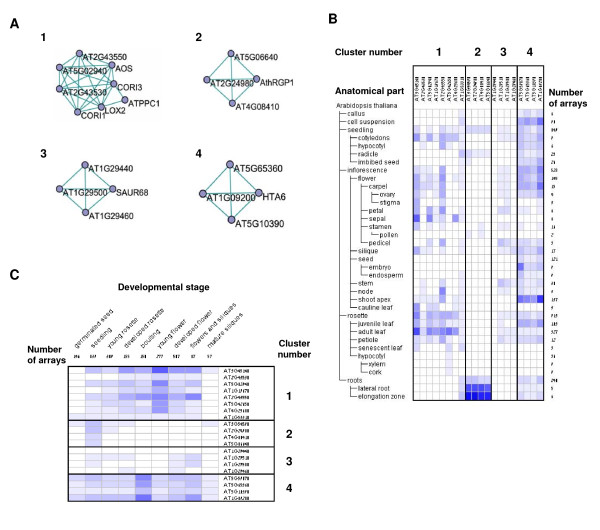
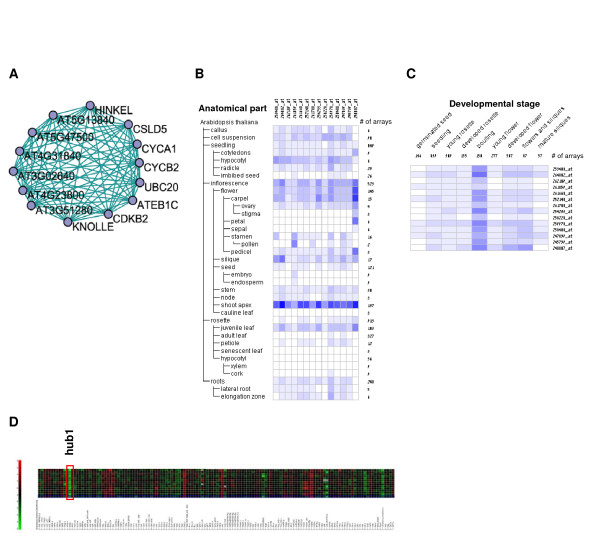
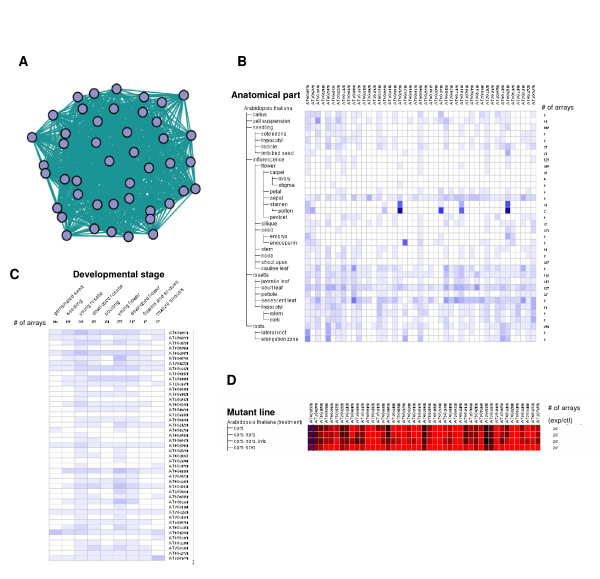
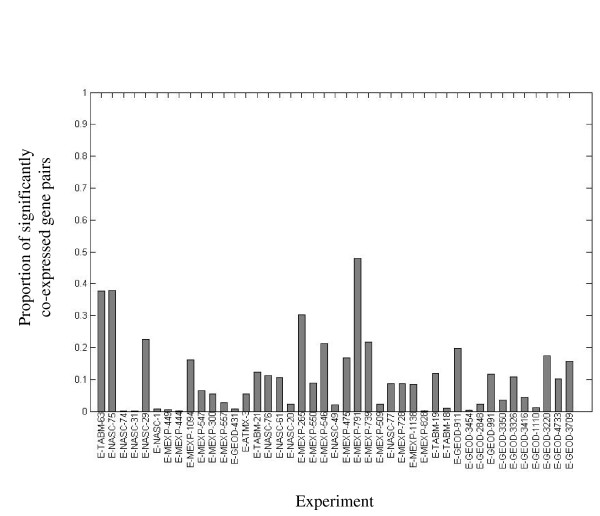
Results: Following the analysis of 21,000 Arabidopsis genes in 43 datasets and about 2 x 10(8) gene pairs, we identified a globally co-expressed gene network. We found clusters of globally co-expressed Arabidopsis genes that are enriched for known Gene Ontology annotations. Two types of modules were identified in the regulatory network that differed in their sensitivity to the node-scoring parameter; we further showed these two pertain to general and specialized modules. Some of these modules were further investigated using the Genevestigator compendium of microarray experiments. Analyses of smaller subsets of data lead to the identification of condition-specific modules.

Conclusion: Our method for identification of gene clusters allows the integration of diverse microarray experiments from many sources. The analysis reveals that part of the Arabidopsis transcriptome is globally co-expressed, and can be further divided into known as well as novel functional gene modules. Our methodology is general enough to apply to any set of microarray experiments, using any scoring function.


Figures

Figure 1
Figure 1
Affects of score thresholds on the co-expression networks. Different score thresholds were used to construct networks as described in the text. For each network tested, several parameters were tested: (A) Number of edges, plotted on a logarithmic scale, (B) Number of nodes, (C) Number of clusters found by the MCODE algorithm. The dashed lines mark the chosen 0.3 and 0.4 thresholds chosen.
Figure 2
Figure 2
Networks of globally co-expressed genes. The network of globally expressed Arabidopsis genes is shown, where the blue nodes are genes and edges connect genes with a co-expression tscore threshold of 0.4. The network is comprised of a highly interconnected network on the left and isolated sub-networks on the right. A network based on the tscore threshold of 0.3 was too crowded to show.
Figure 3
Figure 3
Comparison between experimental and random networks. Each cluster found in the 0.3 (A) or 0.4 (B) networks was plotted as a dot according to cluster size and clustering coefficient. Red dots represent clusters in the experimental networks. Blue dots represent clusters found in 10 different random networks, created by random shuffling of edges in the experimental networks.
Figure 4
Figure 4
Genes clusters found using MCODE. Clusters found using MCODE are visualized as nodes arranged in four levels of decreasing node score cutoff (0.2-0.05) as a parameter for MCODE. Node size corresponds to the number of genes in the cluster. Overlapping clusters (that share genes) are connected by an edge, with edge thickness corresponding to overlap size, with the thickest lines indicating that 100% of the child cluster is present in the parent cluster. Node colour intensity corresponds to GO enrichment. Clusters that have no GO enrichment are brightest, while red clusters have close to 100% of the genes sharing an enriched GO term. For clusters with more then one enriched GO term, color intensity shows the percent of genes having the most abundant term. A green asterisk appears above GO-enriched clusters that were used for further analysis. The number besides the asterisk corresponds to the cluster number given in Tables 4 and 5, and in Figure 5. A green plus sign appears above a non GO-enriched cluster that is assigned a putative cell cycle regulation role (see Results and Figure 6).
Figure 5
Figure 5
Analysis of gene modules using Genevestigator. Expression of four clusters (see Tables 6 and 7, Figure 4) was analyzed using Genevestigator. (A) Graph showing the genes in the clusters and the edges that exist between them in the 0.3 and 0.4 networks (each cluster shows edges from the network it was detected in). Expression according to (B) anatomical tissues or (C) developmental stages, is shown. Expression levels are shown in heat maps, where dark blue indicates maximal expression. Figures in B and C were generated using Genevestigator.
Figure 6
Figure 6
Genevestigator analysis of a putative cell-cycle regulated cluster. Cluster 7 from the 0.3 network, detected using the 0.2 node score cutoff, (see gene list at Table 7, Figure 4) was analyzed using Genevestigator. (A) Graph showing the genes in the cluster and the edges that exist between them in the 0.3 network. Expression according to (B) anatomical tissues or (C) developmental stages, is shown. Expression levels in B and C are shown in heat maps, where dark blue indicates maximal expression. (D) Gene expression in different mutants. Expression levels are shown in a heat map in which intense green and red indicate down- or up-regulation in comparison to wild type, respectively. The red rectangle emphasizes the genes expression in the hub1 mutant (see text for details). Figures in B, C and D were generated using Genevestigator.
Figure 7
Figure 7
Genevestigator analysis of a pathogen response cluster from the pathogen response network. Expression of a cluster found using pathogen stress experiments was analyzed using Genevestigator. (A) Graph showing the genes in the cluster and the edges that exist between them in the pathogen stress network. Expression according to (B) anatomical tissues or (C) developmental stages, is shown. Expression levels are shown in heat maps, where dark blue indicates maximal expression. Expression levels in B and C are shown in heat maps, where dark blue indicates maximal expression. (D) Gene expression in different cpr5 mutants. Expression levels are shown in a heat map in which intense green and red indicate down- or up-regulation in comparison to wild type, respectively. Figures in B, C and D were generated using Genevestigator.
Figure 8
Figure 8
Distribution of Pearson correlation coefficients in selected datasets. The two datasets with the highest rate of significant correlation coefficients, two with an average rate and the two with the lowest rate are shown. The ID of the dataset and the percent of significantly correlated gene pairs are shown above each graph. N denotes the number of microarrays used in the experiment and a short description of experimental conditions is included.
Figure 9
Figure 9
Percent of significantly co-expressed gene pairs the experiments used. For each experiment we calculated the number of significantly co-expressed gene pairs that were included in the analysis. The data is presented as a proportion out of all possible gene pairs. Co-expression between a pair of genes is considered as significant if the p-value calculated for the Pearson correlation coefficient is below 0.05.

References

    1. Eisen MB, Spellman PT, Brown PO, Botstein D. Cluster analysis and display of genome-wide expression patterns. Proc Natl Acad Sci USA. 1998;95(25):14863–14868. doi: 10.1073/pnas.95.25.14863. - DOI - PMC - PubMed
    1. Tamayo P, Slonim D, Mesirov J, Zhu Q, Kitareewan S, Dmitrovsky E, Lander ES, Golub TR. Interpreting patterns of gene expression with self-organizing maps: methods and application to hematopoietic differentiation. Proc Natl Acad Sci USA. 1999;96(6):2907–2912. doi: 10.1073/pnas.96.6.2907. - DOI - PMC - PubMed
    1. Tavazoie S, Hughes JD, Campbell MJ, Cho RJ, Church GM. Systematic determination of genetic network architecture. Nat Genet. 1999;22(3):281–285. doi: 10.1038/10343. - DOI - PubMed
    1. Ben-Dor A, Shamir R, Yakhini Z. Clustering gene expression patterns. J Comput Biol. 1999;6(3-4):281–297. doi: 10.1089/106652799318274. - DOI - PubMed
    1. Sharan R, Maron-Katz A, Shamir R. CLICK and EXPANDER: a system for clustering and visualizing gene expression data. Bioinformatics. 2003;19(14):1787–1799. doi: 10.1093/bioinformatics/btg232. - DOI - PubMed

Publication types

MeSH terms

Substances