

Diffusion-weighted MR imaging derived apparent diffusion coefficient is predictive of clinical outcome in primary central nervous system lymphoma
- PMID: 19729544
- PMCID: PMC3376760
- DOI: 10.3174/ajnr.A1750
Diffusion-weighted MR imaging derived apparent diffusion coefficient is predictive of clinical outcome in primary central nervous system lymphoma
Abstract
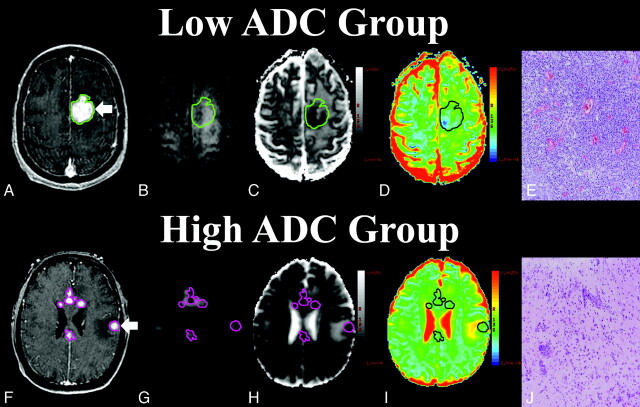
Background and purpose: There is evidence that increased tumor cellular density within diagnostic specimens of primary central nervous system lymphoma (PCNSL) may have significant prognostic implications. Because cellular density may influence measurements of apparent diffusion coefficient (ADC) by using diffusion-weighted MR imaging (DWI), we hypothesized that ADC measured from contrast-enhancing regions might correlate with clinical outcome in patients with PCNSL.
Materials and methods: PCNSL tumors from 18 immunocompetent patients, treated uniformly with methotrexate-based chemotherapy, were studied with pretherapeutic DWI. Enhancing lesions were diagnosed by pathologic analysis as high-grade B-cell lymphomas. Regions of interest were placed around all enhancing lesions allowing calculation of mean, 25th percentile (ADC(25%)), and minimum ADC values. Histopathologic tumor cellularity was quantitatively measured in all patients. High and low ADC groups were stratified by the median ADC value of the cohort. The Welch t test assessed differences between groups. The Pearson correlation examined relationships between ADC measurements and tumor cellular density. Single and multivariable survival analysis was performed.
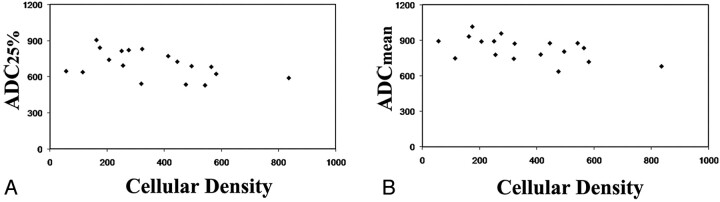
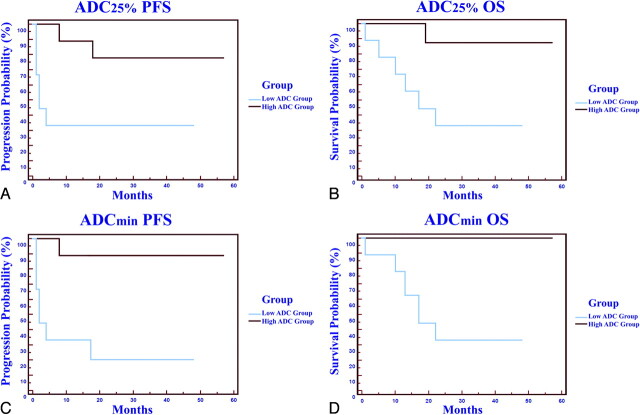
Results: We detected significant intra- and intertumor heterogeneity in ADC measurements. An inverse correlation between cellular density and ADC measurements was observed (P < .05). ADC(25%) measurements less than the median value of 692 (low ADC group) were associated with significantly shorter progression-free and overall survival. Patients with improved clinical outcome were noted to exhibit a significant decrease in ADC measurements following high-dose methotrexate chemotherapy.
Conclusions: Our study provides evidence that ADC measurements within contrast-enhancing regions of PCNSL tumors may provide noninvasive insight into clinical outcome.
Figures
References
-
- Statistical Report: Primary Brain Tumors in the United States, 1998–2002. Hinsdale, Ilinois: Central Brain Tumor Registry of the United States; 2005
-
- Olson JE, Janney CA, Rao RD, et al. . The continuing increase in the incidence of primary central nervous system non-Hodgkin lymphoma: a surveillance, epidemiology, and end results analysis. Cancer 2002; 95: 1504–10 - PubMed
-
- Hochberg F, Baehring J, Hochberg E. Primary CNS lymphoma. Nat Clin Pract Neurol 2007; 3: 24–35 - PubMed
-
- Abrey LE, Batchelor TT, Ferreri AJ, et al. for the International Primary CNS Lymphoma Collaborative Group . Report of an international workshop to standardize baseline evaluation and response criteria for primary CNS lymphoma. J Clin Oncol 2005; 23: 5034–43. Epub 2005 Jun 13 - PubMed
Publication types
MeSH terms
Grants and funding
LinkOut - more resources
Full Text Sources
Other Literature Sources
Medical