. 2009 Oct 21;28(20):3244-55.
doi: 10.1038/emboj.2009.249. Epub 2009 Sep 3.

Neuroligin-1 performs neurexin-dependent and neurexin-independent functions in synapse validation

Affiliations

Neuroligin-1 performs neurexin-dependent and neurexin-independent functions in synapse validation

Jaewon Ko et al. EMBO J. .

Abstract

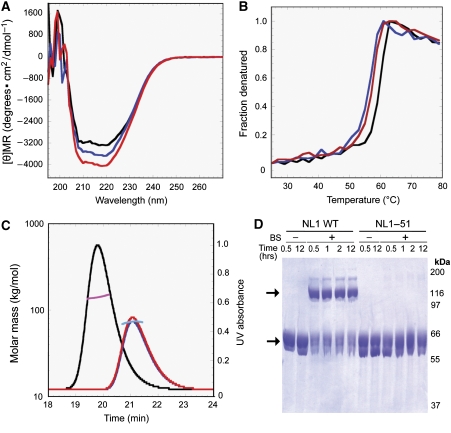
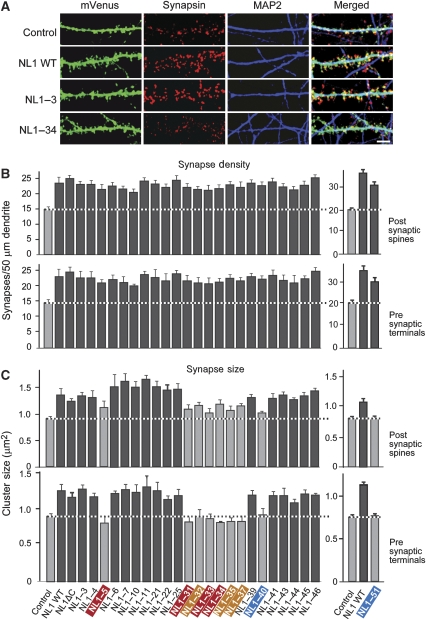
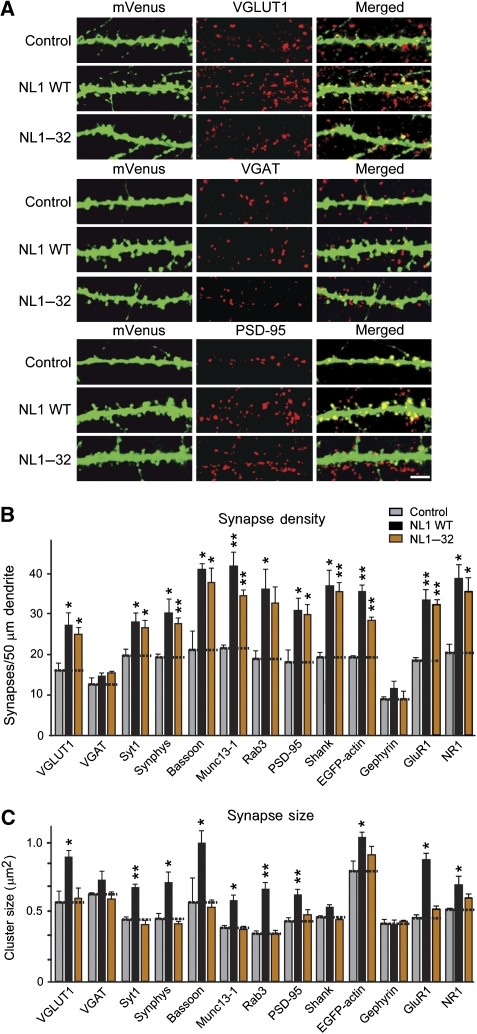
Postsynaptic neuroligins are thought to perform essential functions in synapse validation and synaptic transmission by binding to, and dimerizing, presynaptic alpha- and beta-neurexins. To test this hypothesis, we examined the functional effects of neuroligin-1 mutations that impair only alpha-neurexin binding, block both alpha- and beta-neurexin binding, or abolish neuroligin-1 dimerization. Abolishing alpha-neurexin binding abrogated neuroligin-induced generation of neuronal synapses onto transfected non-neuronal cells in the so-called artificial synapse-formation assay, even though beta-neurexin binding was retained. Thus, in this assay, neuroligin-1 induces apparent synapse formation by binding to presynaptic alpha-neurexins. In transfected neurons, however, neither alpha- nor beta-neurexin binding was essential for the ability of postsynaptic neuroligin-1 to dramatically increase synapse density, suggesting a neurexin-independent mechanism of synapse formation. Moreover, neuroligin-1 dimerization was not required for either the non-neuronal or the neuronal synapse-formation assay. Nevertheless, both alpha-neurexin binding and neuroligin-1 dimerization were essential for the increase in apparent synapse size that is induced by neuroligin-1 in transfected neurons. Thus, neuroligin-1 performs diverse synaptic functions by mechanisms that include as essential components of alpha-neurexin binding and neuroligin dimerization, but extend beyond these activities.


Conflict of interest statement

The authors declare that they have no conflict of interest.

Figures

Figure 1
Figure 1
Analysis of the expression, surface transport, and α- and β-neurexin-binding properties of neuroligin-1 mutations. Panels depict representative data for wild-type neuroligin-1 (NL1 WT) and three key neuroligin-1 mutants that are either retained in the endoplasmic reticulum (NL1–9) or transported to the cell surface, but do not bind α- and β-neurexins (NL1–32) or do not dimerize (NL1–51). For complete datasets of all 37 mutants, see Supplementary Figures S1–S5 and Table I. In this and all following figures, all neuroligin-1 proteins are expressed as mVenus-fusion proteins; Control=mVenus alone. (A) Representative images of transfected HEK293T cells to illustrate the expression and surface transport of neuroligin-1 proteins. Transfected cells were fixed, but not permeabilized, and incubated with neuroligin-1 4C12 monoclonal antibody (raised against the extracellular region of neuroligin-1; Song et al, 1999). Total neuroligin-1 was visualized through its mVenus fluorescence (green), and cell-surface exposed neuroligin-1 by indirect immunofluorescence for the 4C12 antibody (red). Scale bar=4 μm (applies to all images). For quantitations, see Supplementary Figure S2. (B) Immunoblot analysis of neuroligin-1 surface biotinylation. Surface proteins in transfected HEK293T cells expressing neuroligin-1 proteins were biotinylated and affinity purified on immobilized avidin. The input fraction and the biotinylated proteins were analysed by immunoblotting with antibodies to neuroligin-1 (4C12; top) and VCP (valosin-containing protein, bottom; used as a loading control). Note that only fully glycosylated, mature neuroligin-1 (upper band) is biotinylated. (C, D) Binding of Ig-fusion proteins of neurexin-1α (IgN1α-1; C) or -1β (IgN1β-1; D) to transfected HEK293T cells expressing neuroligin-1 proteins. Non-permeabilized transfected cells were incubated with 0.15 μM Ig-fusion proteins, analysed by fluorescence microscopy to visualize total expressed neuroligin-1 (through its mVenus fluorescence; green), and bound by Ig-fusion proteins (through antibodies to human IgG; red); scale bar=4 μm, applies to all panels.
Figure 2
Figure 2
Characterization of neuroligin-1 dimerization mutants. (A) Circular dichroism spectra of wild-type (black), NL1–40 mutant (blue), or NL1–51 mutant neuroligin-1 (red), plotted as the mean residue ellipticity versus wavelength. (B) Temperature denaturation experiments of wild-type (black), NL1–40 mutant (blue), or NL1–51 mutant neuroligin-1 (red) measured by circular dichroism at 220 nm (Tm:wild type=∼59°C, 1–40=57°C; 1–51=58°C). The fractional denaturation was calculated by dividing the decrease in the CD signal at any time by the decrease in the CD signal that is achieved at maximum denaturation. (C) Combined size-exclusion chromatography and multi-angle laser light scattering of wild-type (black and magenta, respectively), NL1–40 mutant (blue and cyan, respectively), or NL1–51 mutant neuroligin-1 (red and green, respectively). Determined sizes: wild type=135.5 kDa; NL1–40=66.5 kDa; NL1–51=67.3 kDa. (D) Chemical crosslinking of wild-type and 1-51 mutant neuroligin-1, treated with 0.5 mM of bis(sulfosuccinimidyl) suberate-d0 (BS) for the indicated amounts of time. Image depicts a coomassie-stained SDS-gel; arrows point to neuroligin-1 monomers and dimers; positions of molecular weight markers are indicated on the right.
Figure 3
Figure 3
Synapse induction by neuroligin-1 mutants expressed in transfected COS cells. (A) Representative images of COS cells that were transfected with mVenus alone (control), wild-type neuroligin-1 (NL1), or the indicated point mutants of neuroligin-1 (see Table I). Transfected COS cells were co-cultured with hippocampal neurons, and examined by double immunofluorescence using antibodies to GFP to identify the transfected mVenus or the mVenus neuroligin-1-fusion proteins (green) and antibodies to synapsin to identify synapses (red). Coincident labelling of red synapses on green transfected COS cells is depicted in yellow (scale bar=30 μm, applies to all images). (B) Quantitative analysis of the fluorescence intensities for synapsin over the transfected COS cells, and for mVenus in the transfected COS-7 cells co-cultured with neurons (AU=arbitrary units; dashed lines=mVenus signal as the baseline). Note that neuroligin-1 mutants that lack neurexin binding failed to induce synapse formation. (C) Normalized synapse density on transfected COS cells co-cultured with neurons, expressed as the ratio of synapsin staining to mVenus fluorescence. In (B–C), data shown are means±s.e.m. (n=3–5 independent experiments). Names for neurexin-binding-deficient mutants are coloured red (selectively α-neurexin-binding-deficient) or orange (α- and β-neurexin-binding-deficient), and for dimerization mutants blue. Grey bars are not statistically significantly different from the mVenus-only control; black bars are statistically significantly different at P<0.01.
Figure 4
Figure 4
Synapse induction and modification by neuroligin-1 mutants expressed in transfected neurons. (A) Representative images of neurons transfected with mVenus only (Control), or mVenus-fusion proteins of wild-type neuroligin-1 (NL1 WT) and the NL1–3 or NL1–34 mutants of neuroligin-1. Transfected neurons were visualized by triple immunofluorescence labelling for mVenus contained in the transfected neuroligins (green; left), the presynaptic marker synapsin (red; left centre), and the dendritic marker MAP2 (blue; right centre). Merged images are shown on the right (white=coincident signal; scale bar=5 μm, applies to all images). For additional representative images, see Supplementary Figure S6. (B, C) Quantitations of synapse density (B) and apparent synapse size (C) on transfected neurons expressing mVenus or the neuroligin-1 constructs listed at the bottom. Data for NL1–51 obtained in separate experiments are shown separately on the right. Synapse density was measured either as the density of light-microscopically identifiable spines (B, top) or of synapsin-positive presynaptic terminals that contact the transfected neuron (B, bottom). The apparent synapse size (C) was measured as the relative fluorescence signal intensity for either the postsynaptic neuroligin-1-fusion protein or the presynaptic synapsin staining. Data shown are means±s.e.m. (n=3–9 independent experiments; colour scheme is the same as in Figure 3). Grey bars are not statistically significantly different from the mVenus-only control; black bars are statistically significantly different at P<0.05.
Figure 5
Figure 5
Analysis of synapse enhancement by neuroligin-1 using multiple markers. (A) Representative images of neurons transfected with mVenus alone (Control), wild-type neuroligin-1 (NL1 WT), or 1–32 mutant neuroligin-1 (NL1–32). Neurons were visualized by double immunofluorescence labelling for mVenus (green) and various pre- and postsynaptic markers as indicated (red; for representative images with additional markers, see Supplementary Figure S7). (B, C) Quantitation of synapse density (B) and size (C) in neurons expressing mVenus alone (grey), wild-type neuroligin-1 (black), or 1–32 mutant neuroligin-1 (orange), using the indicated pre- or postsynaptic marker proteins. Data shown are means±s.e.m. (n=3; *P<0.05, **P<0.01 in pairwise comparisons between control and experimental groups).
Figure 6
Figure 6
Neurexin binding by neuroligin-1 is required for potentiation of the size of functional presynaptic terminals. (A) Representative images of neurons transfected with mVenus alone (Control), wild-type neuroligin-1 (NL1 WT), and NL1–32 mutant neuroligin-1. Neurons were triply stained with mVenus (green), PSD-95 (red), and VGLUT1 (blue). Scale bar=5 μm, applies to all images. (B) Quantitation of the density and size of synapses on transfected neurons in multiple experiments as described in (A); only synapses that are positive for both VGLUT1 and PSD-95 were included. (C) Representative images of neurons transfected with mVenus alone (Control), wild-type neuroligin-1 (NL1 WT), or NL1–32 mutant neuroligin-1 (NL1–32). Neurons were incubated in the presence of antibodies to the lumenal sequence of synaptotagmin-1 (Perin et al, 1991) for 10 min in high K+ medium (57 mM; Matteoli et al, 1992). Afterwards, neurons were fixed, and analysed by double immunofluorescence for mVenus (green, to label the transfected proteins) and the synaptotagmin-1 antibody (red, to label synaptic vescicles undergoing exo- and endocytosis). Scale bar=5 μm, applies to all images. (D) Quantitation of multiple experiments performed as described in (C). Data shown in (B) and (D) are means±s.e.m. (n=3; *P<0.05, **P<0.01 in pairwise comparisons between the control and experimental groups).
Figure 7
Figure 7
Electrophysiological effects of neuroligin-1 mutants in transfected neurons. Neurons were transfected with mVenus alone (Control), with wild-type neuroligin-1 (NL1 WT), various neurexin-binding mutants of neuroligin-1 (NL1–5, –32, and –35), or the NL1–51 dimerization-defective mutant of neuroligin-1. (A) Representative traces (left) and bar diagrams of the frequency (centre) and amplitude (right) of miniature EPSCs. (B) Representative traces (left) and diagram bars of the amplitude (right) of action-potential-evoked AMPAR-dependent EPSCs. (C) Representative traces of NMDA- and AMPA-receptor-dependent EPSCs (left), and bar diagrams of the measured NMDA/AMPA-receptor EPSC ratio (right). (D) Representative traces (left) and diagram bars of the amplitude (right) of action-potential-evoked AMPAR-dependent EPSCs. (E) Representative traces (left) and mean charge transfer (right, integrated over 30 s) of EPSCs elicited by hypertonic sucrose (0.5 M sucrose for 30 s). (F) Representative traces (left) and diagram bars of the frequency (centre) and amplitude (right) of miniature IPSCs in neurons expressing mVenus, wild-type neuroligin-1 (NL1 WT), or NL1–32 neurexin-binding mutant of neuroligin-1 (NL1–32). (G) Representative traces (left) and diagram bars of the amplitude (right) of action-potential-evoked IPSCs. Recordings were from the transfected neurons identified by mVenus fluorescence. The scale bars apply to all traces in a set. Data shown are means±s.e.m. Asterisks above the bar diagrams indicate statistically significant differences in pairwise comparisons between the control and experimental groups (n=3–8 independent experiments; *P<0.05, **P<0.01). Dashed and dotted lines refer to the values of mVenus as a negative control.

Similar articles

Cited by

References

    1. Arac D, Boucard AA, Ozkan E, Strop P, Newell E, Südhof TC, Brunger AT (2007) Structures of neuroligin-1 and the neuroligin-1/neurexin-1beta complex reveal specific protein-protein and protein-Ca2+ interactions. Neuron 56: 992–1003 - PubMed
    1. Baksh MM, Dean C, Pautot S, Demaria S, Isacoff E, Groves JT (2005) Neuronal activation by GPI-linked neuroligin-1 displayed in synthetic lipid bilayer membranes. Langmuir 21: 10693–10698 - PMC - PubMed
    1. Berninghausen O, Rahman MA, Silva JP, Davletov B, Hopkins C, Ushkaryov YA (2007) Neurexin Ibeta and neuroligin are localized on opposite membranes in mature central synapses. J Neurochem 103: 1855–1863 - PMC - PubMed
    1. Biederer T, Sara Y, Mozhayeva M, Atasoy D, Liu X, Kavalali ET, Südhof TC (2002) SynCAM, a synaptic adhesion molecule that drives synapse assembly. Science 297: 1525–1531 - PubMed
    1. Bolliger MF, Frei K, Winterhalter KH, Gloor SM (2001) Identification of a novel neuroligin in humans which binds to PSD-95 and has a widespread expression. Biochem J 356: 581–588 - PMC - PubMed

Publication types

MeSH terms