. 2009 Sep;5(9):e1000573.
doi: 10.1371/journal.ppat.1000573. Epub 2009 Sep 4.

CD8(+) T cells restrict Yersinia pseudotuberculosis infection: bypass of anti-phagocytosis by targeting antigen-presenting cells

Affiliations

CD8(+) T cells restrict Yersinia pseudotuberculosis infection: bypass of anti-phagocytosis by targeting antigen-presenting cells

Molly A Bergman et al. PLoS Pathog. 2009 Sep.

Abstract

All Yersinia species target and bind to phagocytic cells, but uptake and destruction of bacteria are prevented by injection of anti-phagocytic Yop proteins into the host cell. Here we provide evidence that CD8(+) T cells, which canonically eliminate intracellular pathogens, are important for restricting Yersinia, even though bacteria are primarily found in an extracellular locale during the course of disease. In a model of infection with attenuated Y. pseudotuberculosis, mice deficient for CD8(+) T cells were more susceptible to infection than immunocompetent mice. Although exposure to attenuated Y. pseudotuberculosis generated T(H)1-type antibody responses and conferred protection against challenge with fully virulent bacteria, depletion of CD8(+) T cells during challenge severely compromised protective immunity. Strikingly, mice lacking the T cell effector molecule perforin also succumbed to Y. pseudotuberculosis infection. Given that the function of perforin is to kill antigen-presenting cells, we reasoned that cell death marks bacteria-associated host cells for internalization by neighboring phagocytes, thus allowing ingestion and clearance of the attached bacteria. Supportive of this model, cytolytic T cell killing of Y. pseudotuberculosis-associated host cells results in engulfment by neighboring phagocytes of both bacteria and target cells, bypassing anti-phagocytosis. Our findings are consistent with a novel function for cell-mediated immune responses protecting against extracellular pathogens like Yersinia: perforin and CD8(+) T cells are critical for hosts to overcome the anti-phagocytic action of Yops.


Conflict of interest statement

The authors have declared that no competing interests exist.

Figures
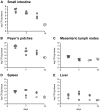
Figure 1
Figure 1. Y. pseudotuberculosis ksgA is Attenuated in a Murine Model of Infection.
C57BL/6 mice were orally inoculated with 5×10⁸ CFU of mutant ksgA strain and mice sacrificed at days 3, 7, 11 and 14 post-inoculation. The number of bacteria in the small intestine (A), Peyer's patches (B), mesenteric lymph nodes (C), spleen (D) and liver (E) was determined by plate assay and normalized to gram tissue weight. Open symbols indicate that the bacterial numbers were below the limit of detection. Each symbol indicates one mouse.
Figure 2
Figure 2. Colonization by ksgA Induces TH1-type Antibodies and Activates T Cell Responses.
Naïve mice or mice orally inoculated with ksgA bacteria 60 days prior were sacrificed, sera harvested and assayed for Y. pseudotuberculosis-specific antibodies. Shown are the half-maximal titer of “total” serum antibodies (combined IgM, IgA, IgD, IgG) (A), and the concentrations of IgA (B), and IgG1 and IgG2a serum antibodies (C) specific to total Yersinia antigen. 7 days post-oral inoculation, the percentage of CD69+ CD4+ (D) or CD69+ CD8+ (E) T cells present in the Peyer's patches (PP) and mesenteric lymph nodes (MLN) was determined. Each symbol represents one animal: filled symbols are animals exposed to Y. pseudotuberculosis and open symbols are naïve animals.
Figure 3
Figure 3. β2-Microglobulin-Deficient Mice Are Highly Susceptible to Attenuated Y. pseudotuberculosis.
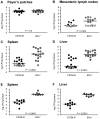
C57BL/6 (black circles) or B2m −/− (grey circles) mice were orally inoculated with 5×10⁸ CFU attenuated ksgA bacteria, sacrificed at day 8–10 post-inoculation and bacterial burden assayed in Peyer's patches (A), mesenteric lymph nodes (B), spleen (C), and liver (D). Open symbols indicate values below the limit of detection for that organ. Alternatively, C57BL/6 mice or B2m−/− mice were intravenously inoculated with 2×10² CFU ksgA bacteria, sacrificed at day 10 post-inoculation and bacteria burden in the spleen (E) and liver (F) determined. Each symbol represents one animal, lines are median values. Data shown is pooled from two-three separate experiments.
Figure 4
Figure 4. CD8+ T cells are Required to Protect Against Y. pseudotuberculosis.
Naïve mice were given phosphate-buffered saline (PBS, black circles) or CD8-depleting antibody 2.43 (α-CD8, grey circles) prior and subsequent to intravenous inoculation with 102 CFU ksgA bacteria, sacrificed at day 14 post-inoculation and CFU enumerated in the spleen (A) and liver (B). Open symbols indicate the limit of detection for that organ, each symbol represents one mouse, and lines are median values. Data shown is pooled from three separate experiments. (C) To examine protection in immune animals, at 60 days post-oral ksgA immunization, mice received PBS (black circles) or CD8-depleting antibody 2.43 (α-CD8, grey circles) prior and subsequent to intravenous inoculation with 104 CFU virulent YPIII pIB1 (ksgA+) bacteria. Morbidity and mortality was followed for 14 days post-challenge and % survival shown by Kaplan-Meier plots. Data is representative of two experiments.
Figure 5
Figure 5. Perforin Is Required to Restrict Y. pseudotuberculosis Colonization.
C57BL/6 (black circles) or perforin-deficient animals (PKO, grey circles) mice were intravenously inoculated with 102 attenuated ksgA bacteria and mice sacrificed at day 14–15 post-inoculation to assay bacterial burden in spleen (A), and liver (B). To examine protection in immune animals, at 60 days post-intravenous ksgA immunization, mice were intravenously challenged with 103 CFU virulent YPIII pIB1 (ksgA+) bacteria and bacterial burden assayed in the spleen (C) and liver (D) at day 7 post-challenge. Open symbols indicate the limit of detection for that organ. Each symbol represents one mouse, lines are median values. Data shown is pooled from two-three separate experiments.
Figure 6
Figure 6. Y. pseudotuberculosis Localizes Extracellularly in the Spleen Despite the Absence of Cytolytic T cell Control.
Single cell suspensions of spleens from animals exposed to bacteria were assayed for the presence of intracellular bacteria using a gentamicin protection assay – spleen cells were assayed for CFU without and with gentamicin treatment, and % gentamicin-protected bacteria calculated (see Materials and Methods). (A) C57BL/6 mice were intravenously inoculated with Y. pseudotuberculosis strain YPIII pIB1 or IP26666 (2×10³ CFU), or S. typhimurium strain SL1344 (5×10² CFU) and sacrificed 3–5 days post-inoculation. (B) C57BL/6, PKO and B2m−/− mice were intravenously inoculated with 102 CFU ksgA bacteria and sacrificed after 10–14 days post-inoculation. (C) Naïve or Y. pseudotuberculosis-immune C57BL/6 mice treated with PBS or CD8-depleting antibody 2.43 (see Figure 4 legend) were challenged with 104 virulent YPIII pIB1 and sacrificed day 4 post-challenge. Values show means and S.E.M. for several experiments; number of animals used for each condition is listed below each experimental condition.
Figure 7
Figure 7. CTL Targeting of Y. pseudotuberculosis-Associated APCs Does Not Induce Bacterial Uptake by APCs.
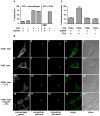
(A) Bone-marrow derived macrophages were pulsed with CrpA63–71 peptide, infected with Y. pseudotuberculosis and exposed to CrpA63–71-specific CTLs at a ratio of 10∶1 CTL∶APC for four hours, after which culture supernatants were evaluated for the presence of the cytoplasmic enzyme lactate dehydrogenase (LDH). The EL4 thymoma cells were used as control antigen-presenting cells. Released LDH was normalized to the maximal amount of released LDH and % cytotoxicity calculated (see Methods). Shown are the mean and standard error of the mean (SEM) for triplicate samples. (B) Macrophages were treated with peptide and Y. pseudotuberculosis, exposed to CTLs at a ratio of 10∶1 CTL∶APC for 15 minutes, then cells were fixed and assayed for the presence of extra- and intracellular bacteria by immunofluorescence microscopy. Representative images from one of four experiments are shown. Macrophage treatment conditions: panels 1–5 T3SS+ bacteria, panels 6–10 T3SS bacteria, panels 11–15 T3SS+ bacteria and CrpA-specific CTLs (no peptide), panels 16–20 T3SS+ bacteria, CrpA63–71 peptide, and CrpA-specific CTLs. Panels from left to right show CD11b+ macrophages (green), extracellular Yersinia (red), internalized Yersinia (blue), merged images, and phase contrast. White bar represents 10 µm. (C) Quantification of intracellular bacteria: infected macrophages were scored for intra- and extracellular bacteria and % intracellular Y. pseudotuberculosis calculated. Values shown are mean and SEM for triplicate samples, and results are representative of three experiments.
Figure 8
Figure 8. CTL Targeting Eliminates Both APCs and APC-Associated Y. pseudotuberculosis by Bystander Phagocytosis.
(A) Immunofluorescence images of GFP+ APCs, pre-treated with media (panels 1–3), apoptosis-inducing gliotoxin (panels 4–6), Y. pseudotuberculosis (panels 7–9), Y. pseudotuberculosis and CrpA-specific CTLs (panels 10–12), or Y. pseudotuberculosis, CrpA63–71 peptide and CrpA-specific CTLs (panels 13–15), then exposed to IFNγ-activated macrophages. Panels from left to right show merged images of GFP+ APCs (green) with extracellular Yersinia (pink) and intracellular Yersinia (blue) (merge), phase contrast (phase), and phase contrast merged with GFP+ APCs (GFP and phase). Arrowheads indicate GFP+ cells, arrows indicate bacteria. White bar represents 10 µm. (B) Quantification of GFP+ host cells phagocytosed by activated macrophages. GFP+ cells were scored as unattached, attached or ingested by GFP activated macrophages and % ingested GFP+ host cells calculated. (C) Quantification of localization of Y. pseudotuberculosis associated with GFP+ APCs was performed similarly as described in Figure 7 legend: bacteria associated with GFP+ APCs were scored for intra- and extracellular localization and % intracellular bacteria calculated. Results shown are the mean and SEM of three triplicate samples per experiment; results are representative of three separate experiments. (D) Quantification of intracellular bacteria in macrophages exposed to TTSS+ or TTSS Y. pseudotuberculosis (no CTLs or peptide present). (E) Model of CTL restriction of Y. pseudotuberculosis: CTLs target bacteria-associated antigen-presenting cells for killing, apoptotic cells and attached bacteria are then engulfed and removed by neighboring phagocytes.

References

    1. Brubaker RR. The genus Yersinia: biochemistry and genetics of virulence. Curr Top Microbiol Immunol. 1972;57:111–158. - PubMed
    1. Prentice MB, Rahalison L. Plague. Lancet. 2007;369:1196–1207. - PubMed
    1. Naktin J, Beavis KG. Yersinia enterocolitica and Yersinia pseudotuberculosis. Clin Lab Med. 1999;19:vi. - PubMed
    1. Carter PB. Pathogenecity of Yersinia enterocolitica for mice. Infect Immun. 1975;11:164–170. - PMC - PubMed
    1. Carter PB, Collins FM. Experimental Yersinia enterocolitica infection in mice: kinetics of growth. Infect Immun. 1974;9:851–857. - PMC - PubMed

Publication types

MeSH terms