

Female fertility and longevity
- PMID: 19731082
- PMCID: PMC2829636
- DOI: 10.1007/s11357-009-9116-1
Female fertility and longevity
Abstract
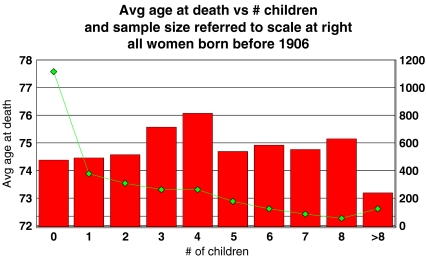
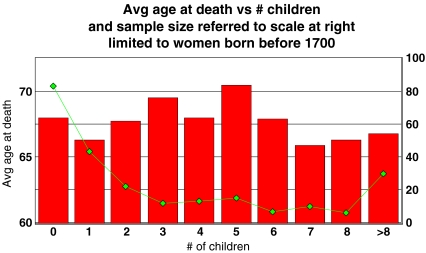
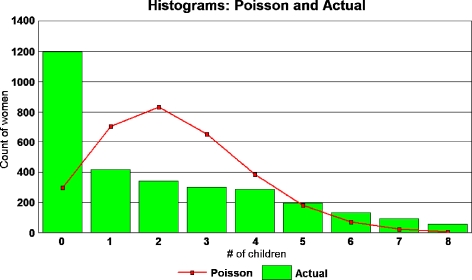
Does bearing children shorten a woman's life expectancy? Pleiotropic theories of aging predict that it should, and in particular, the Disposable Soma theory predicts unequivocally that this effect should be inescapable. But many demographic studies, historic and current, have found no such effect. In this context,the Caerphilly cohort study stands apart as the sole test that corroborates the theory. Why has this study found an effect that others fail to see? Their analysis is based on Poisson regression, a statistical technique that is accurate only if the underlying data are Poisson distributed.But the distribution of the number of children born to women in the Caerphilly data based departs strongly from Poisson at the high end. This makes the result overly sensitive to a handful of women with 15 children or more who lived before 1700. When these five women are removed from a database of more than 2,900, the Poisson regression no longer shows a significant result. Bilinear regression relating life span to fertility and date of birth results in a small positive coefficient for fertility, in agreement with the main trend of reported results.
Figures
References
-
- Beeton M, Yule GU, Pearson K. On the correlation between duration of life and the number of offspring. Proc Royal Soc B. 1900;65:290–305.
-
- Bloore J. Peerage CD-ROM. 13. Salisbury: S&N Genealogical Supplies; 2000.
-
- Finch CE. Longevity, senescence and the genome. Chicago: University of Chicago Press; 1990.
-
- Gavrilova NS, Gavrilov LA. Human longevity and reproduction: an evolutionary perspective. In: Voland E, Chasiotis A, Schiefenhövel W, editors. Grandmotherhood. Rutgers University Press: New Brunswick; 2005. pp. 59–80.
Publication types
MeSH terms
LinkOut - more resources
Full Text Sources